8.6 visreg package
The
visregpackage provides tools for visualizing these conditional relationships.The
visregfunction takes (1) the model and (2) the variable of interest and plots the conditional relationship, controlling for the other variables.The option
gg = TRUEis used to produce aggplot2graph.
# conditional plot of price vs. living area
library(ggplot2)
library(visreg)
visreg(houses_lm, "livingArea", gg = TRUE) 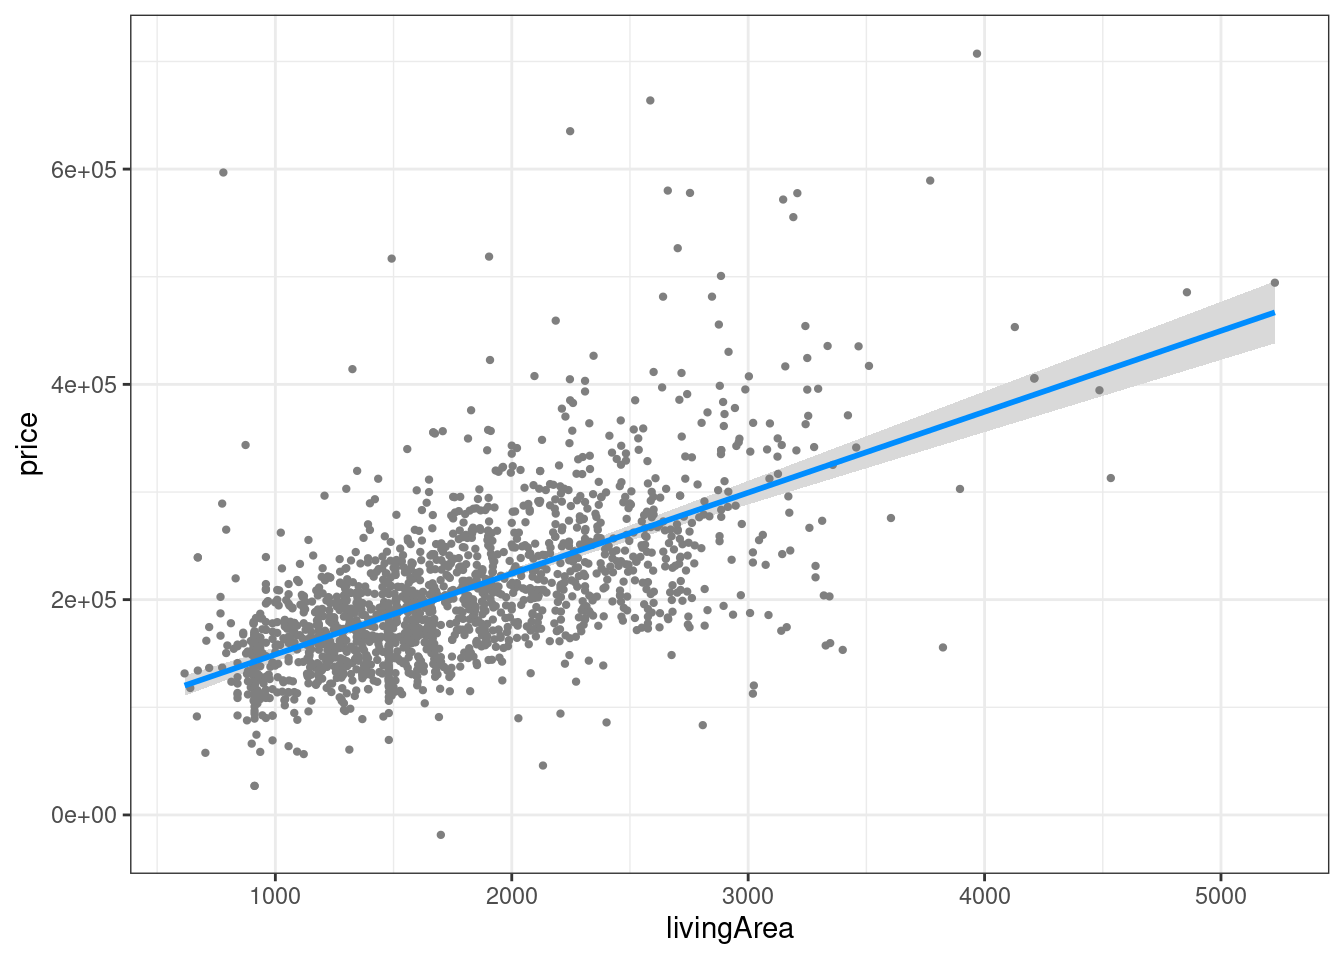
- The graph suggests that, holding all else equal, sales price increases with living area in a linear fashion.