7.22 Modified Stacked Area Chart
# load data
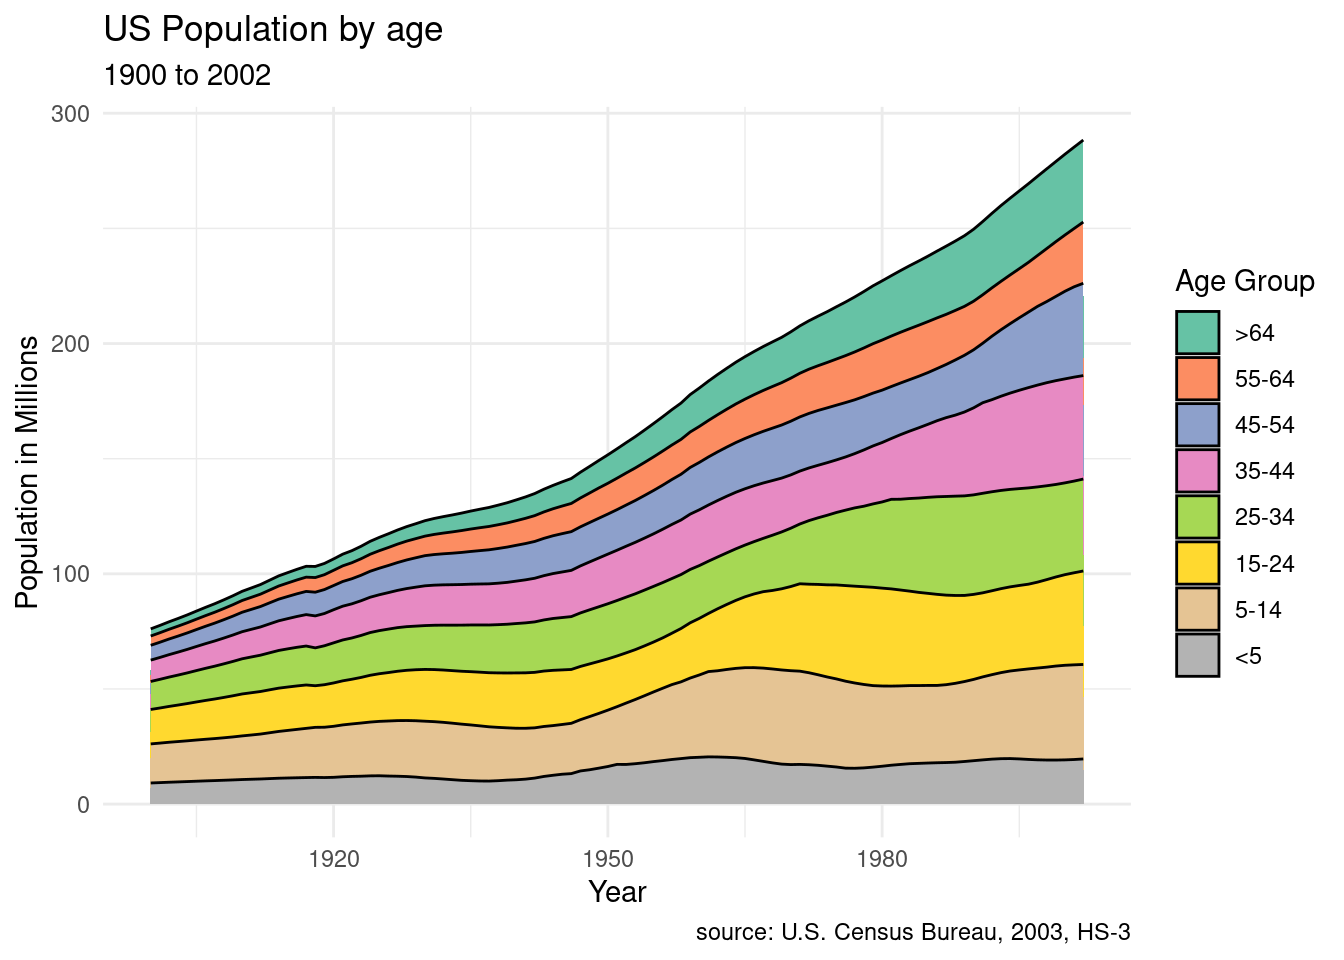
data(uspopage, package = "gcookbook")
ggplot(uspopage, aes(x = Year,
y = Thousands/1000,
fill = forcats::fct_rev(AgeGroup))) +
geom_area(color = "black") +
labs(title = "US Population by age",
subtitle = "1900 to 2002",
caption = "source: U.S. Census Bureau, 2003, HS-3",
x = "Year",
y = "Population in Millions",
fill = "Age Group") +
scale_fill_brewer(palette = "Set2") +
theme_minimal()