8.16 Mosaic plots and the vcd package
Although mosaic charts can be created with
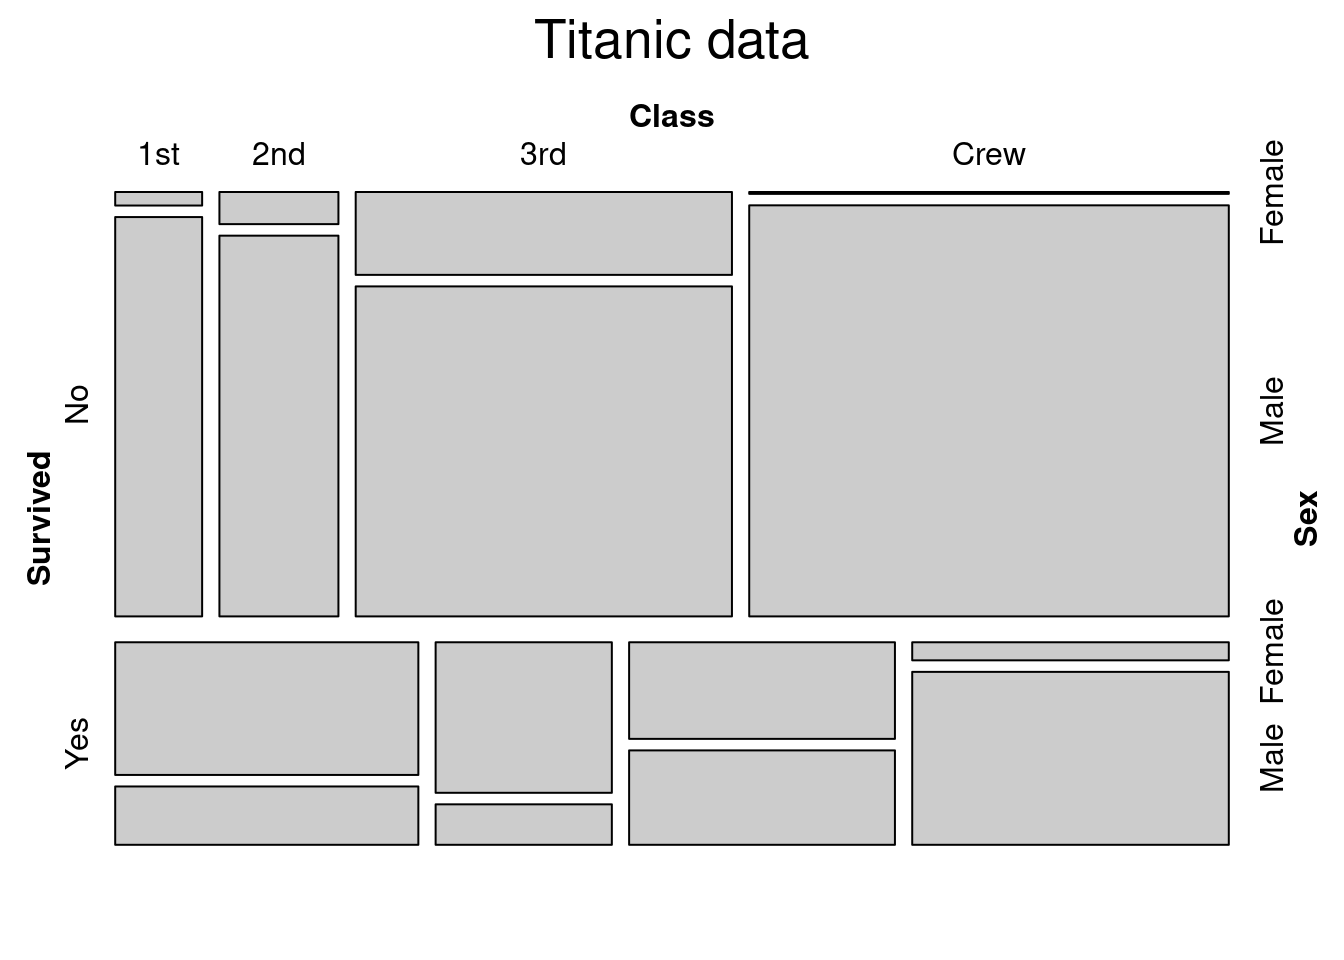
ggplot2using theggmosaicpackage, the author recommends using thevcdpackage instead, which won’t createggplot2graphs, but provides a more comprehensive approach to visualizing categorical data.In a mosaic plot, the size of the tile is proportional to the percentage of cases in that combination of levels.
For example, as seen below, more Titanic passengers perished than survived, and those that perished were primarily 3rd class male passengers and male crew (the largest group).