Data by country
- world map and color the countries by life expectancy using the 2007 gapminder data
# view the first 12 region names in country.map
data(country.map, package = "choroplethrMaps")

head(unique(country.map$region), 12)
##  [1] "afghanistan" "angola"      "azerbaijan"  "moldova"     "madagascar"
##  [6] "mexico"      "macedonia"   "mali"        "myanmar"     "montenegro"
## [11] "mongolia"    "mozambique"
# prepare dataset
data(gapminder, package = "gapminder")

plotdata <- gapminder %>%
  filter(year == 2007) %>%
  rename(region = country,
         value = lifeExp) %>%
  mutate(region = tolower(region)) %>%
  mutate(region = recode(region,
                          "united states"    = "united states of america",
                          "congo, dem. rep." = "democratic republic of the congo",
                          "congo, rep."      = "republic of congo",
                          "korea, dem. rep." = "south korea",
                          "korea. rep."      = "north korea",
                          "tanzania"         = "united republic of tanzania",
                          "serbia"           = "republic of serbia",
                          "slovak republic"  = "slovakia",
                          "yemen, rep."      = "yemen"))

head(plotdata)
## # A tibble: 6 × 6
##   region      continent  year value      pop gdpPercap
##   <chr>       <fct>     <int> <dbl>    <int>     <dbl>
## 1 afghanistan Asia       2007  43.8 31889923      975.
## 2 albania     Europe     2007  76.4  3600523     5937.
## 3 algeria     Africa     2007  72.3 33333216     6223.
## 4 angola      Africa     2007  42.7 12420476     4797.
## 5 argentina   Americas   2007  75.3 40301927    12779.
## 6 australia   Oceania    2007  81.2 20434176    34435.
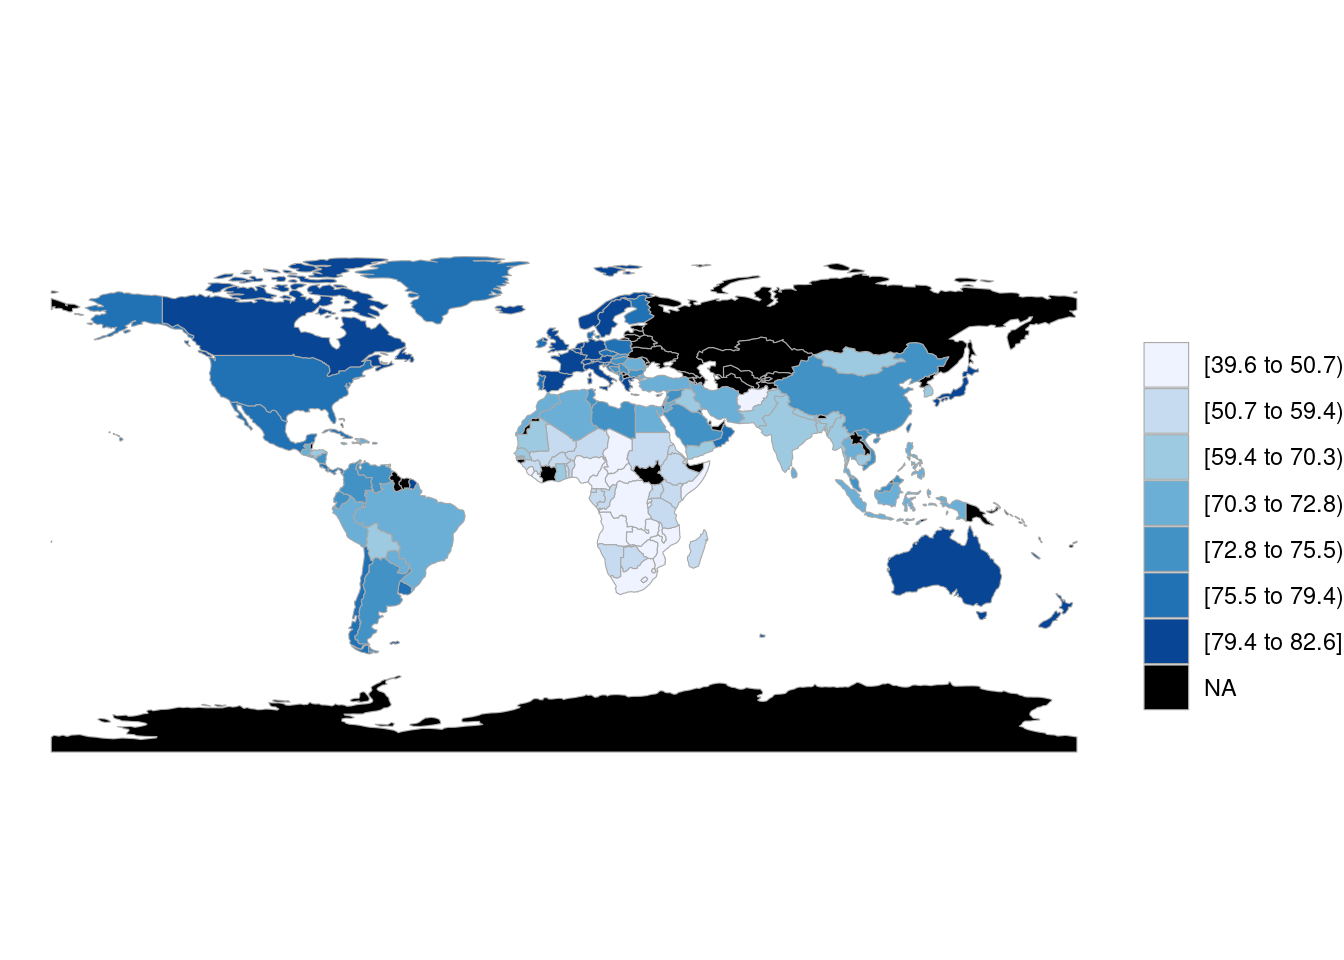
library(choroplethr)

country_choropleth(plotdata)
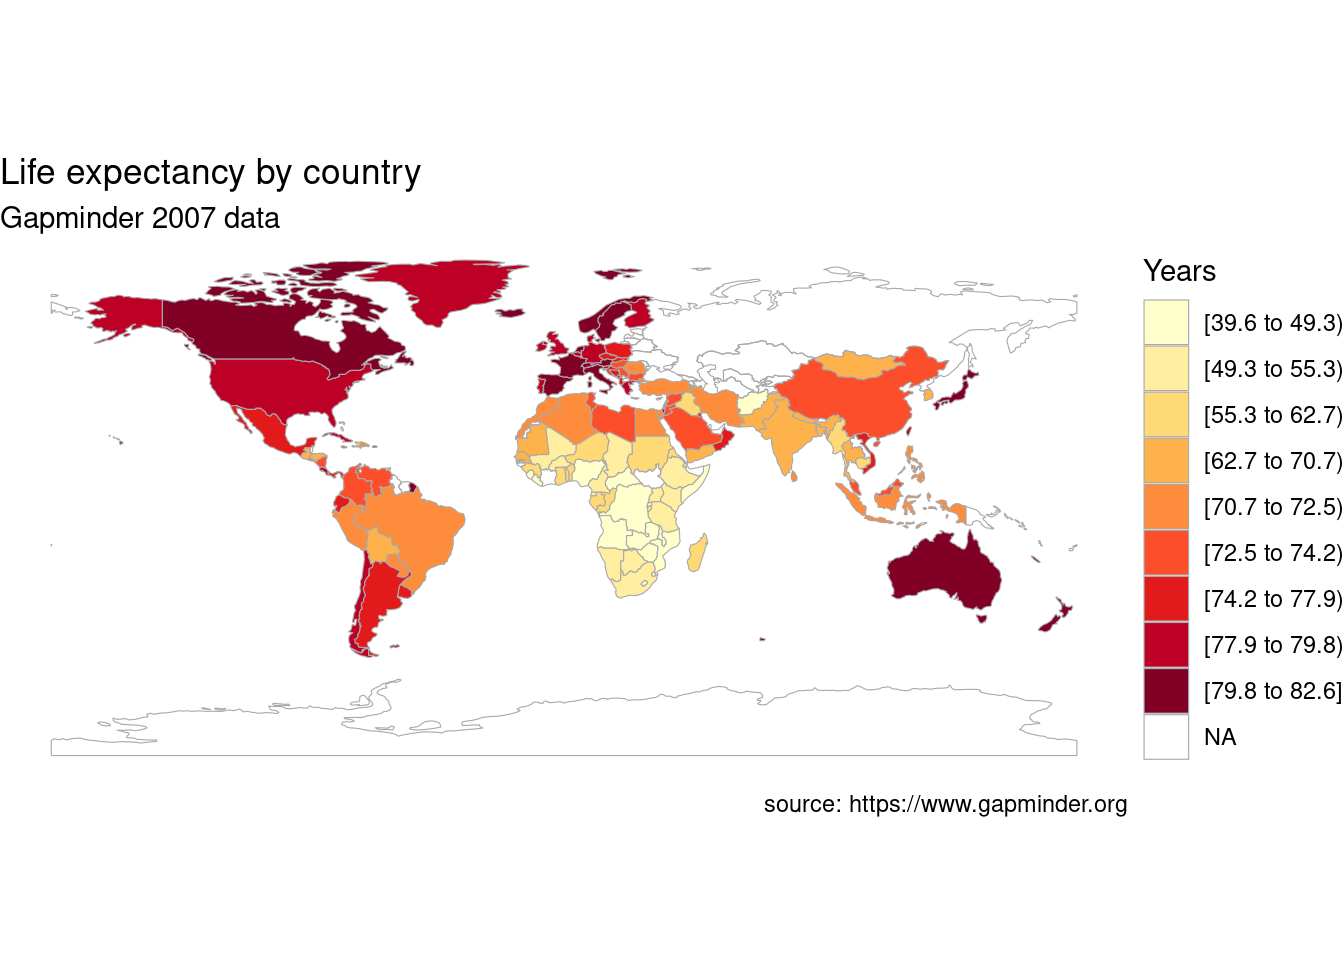
- choroplethr functions return ggplot2 graphs. Let’s make it a bit more attractive by modifying the code with additional ggplot2 functions.
country_choropleth(plotdata,
                   num_colors=9) +
  scale_fill_brewer(palette="YlOrRd") +
  labs(title = "Life expectancy by country",
       subtitle = "Gapminder 2007 data",
       caption = "source: https://www.gapminder.org",
       fill = "Years")