9.3 Modified 3-D Scatterplot (cont.)
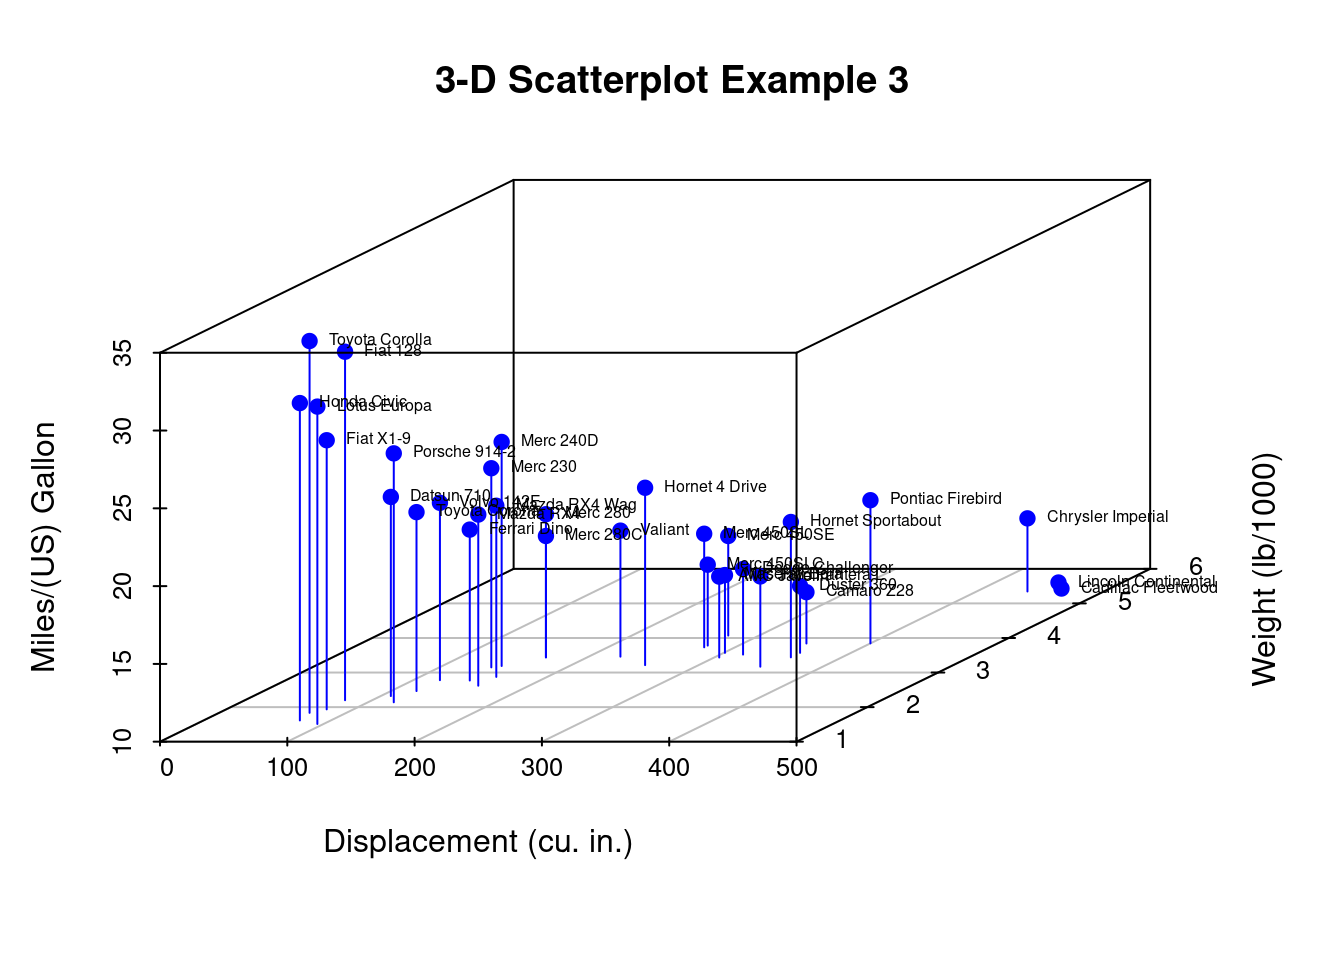
Here, we label the points. We can do this by
saving the results of the
scatterplot3dfunction to an object,using the
xyz.convertfunction to convert coordinates from 3-D (x, y, z) to 2D-projections (x, y), andapply the
textfunction to add labels to the graph.
library(scatterplot3d)
with(mtcars, {
  s3d <- scatterplot3d( x = disp, y = wt, z = mpg,
    color = "blue", pch = 19, type = "h",
    main = "3-D Scatterplot Example 3",
    xlab = "Displacement (cu. in.)",
    ylab = "Weight (lb/1000)",
    zlab = "Miles/(US) Gallon")

  # convert 3-D coords to 2D projection
  s3d.coords <- s3d$xyz.convert(disp, wt, mpg)

  # plot text with 50% shrink and place to right of points
  text(s3d.coords$x, s3d.coords$y,
       labels = row.names(mtcars), cex = .5, pos = 4)
})