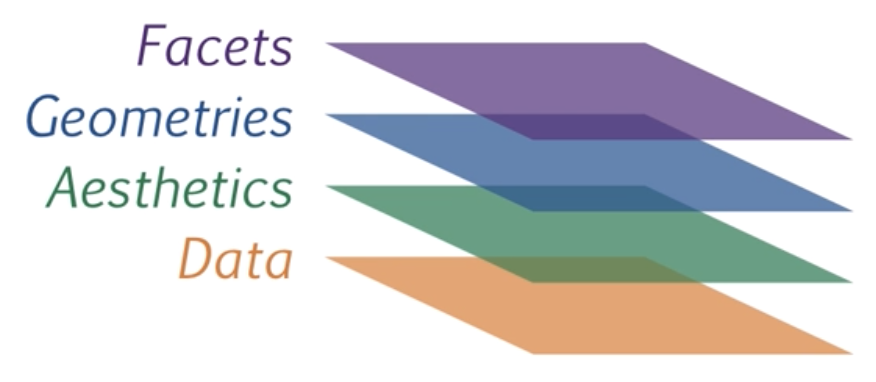
2.9 Facets Layer
The facet layer allows us to create subplots within the same graphic object
# reproduce plot for each level of job sector
ggplot(data = plotdata,
       mapping = aes(x = exper,
                     y = wage,
                     color = sex)) +
  geom_point(alpha = .7) +
  geom_smooth(method = "lm",
              se = FALSE) +
  scale_x_continuous(breaks = seq(0, 60, 10)) +
  scale_y_continuous(breaks = seq(0, 30, 5),
                     label = scales::dollar) +
  scale_color_manual(values = c("indianred3",
                                "cornflowerblue")) +
  facet_wrap(~sector)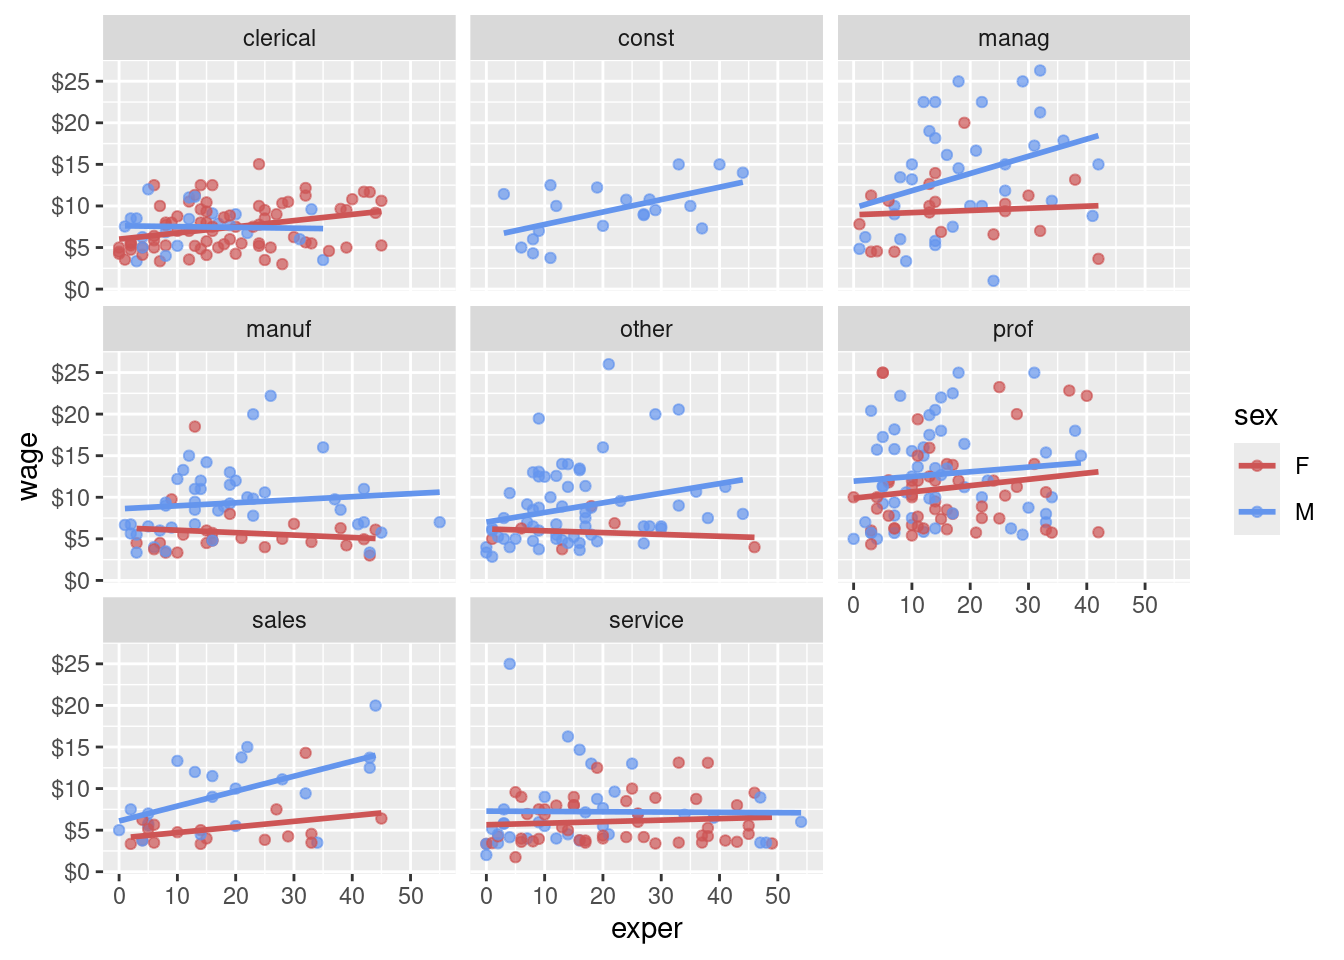
- It appears that the differences between men and women depend on the job sector under consideration.