7.10 Dumbbell Charts
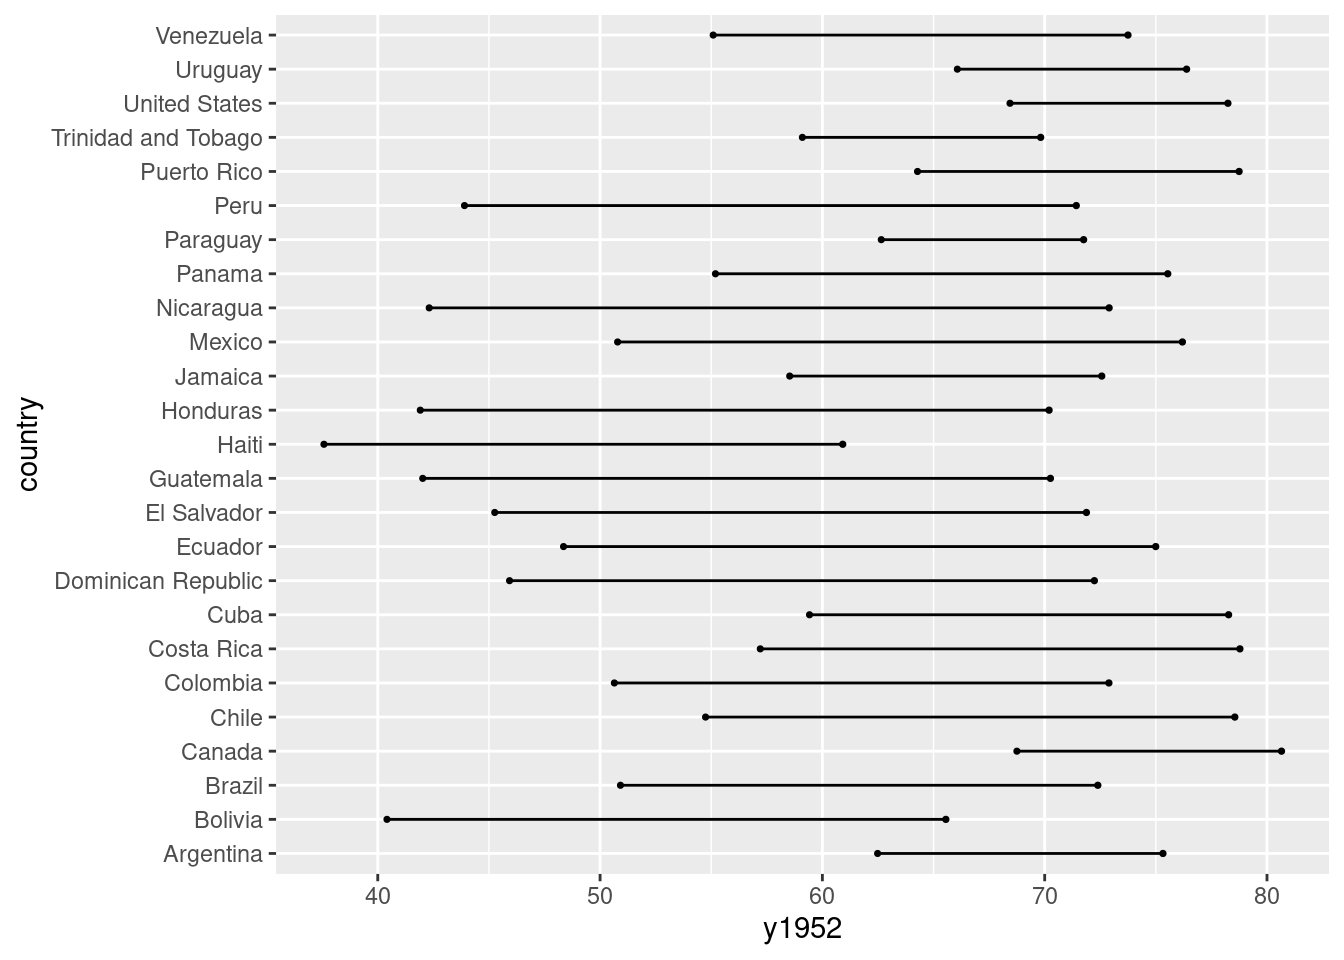
Let’s plot the change in life expectancy from 1952 to 2007 in the Americas.
# load library
library(ggalt)
library(tidyr)
library(dplyr)

# load data
data(gapminder, package = "gapminder")

# subset data
plotdata_long <- filter(gapminder,
                        continent == "Americas" &
                        year %in% c(1952, 2007)) %>%
  select(country, year, lifeExp)

# convert data to wide format
plotdata_wide <- spread(plotdata_long, year, lifeExp)
names(plotdata_wide) <- c("country", "y1952", "y2007")

# create dumbbell plot
ggplot(plotdata_wide, aes(y = country,
                          x = y1952,
                          xend = y2007)) +
  geom_dumbbell()