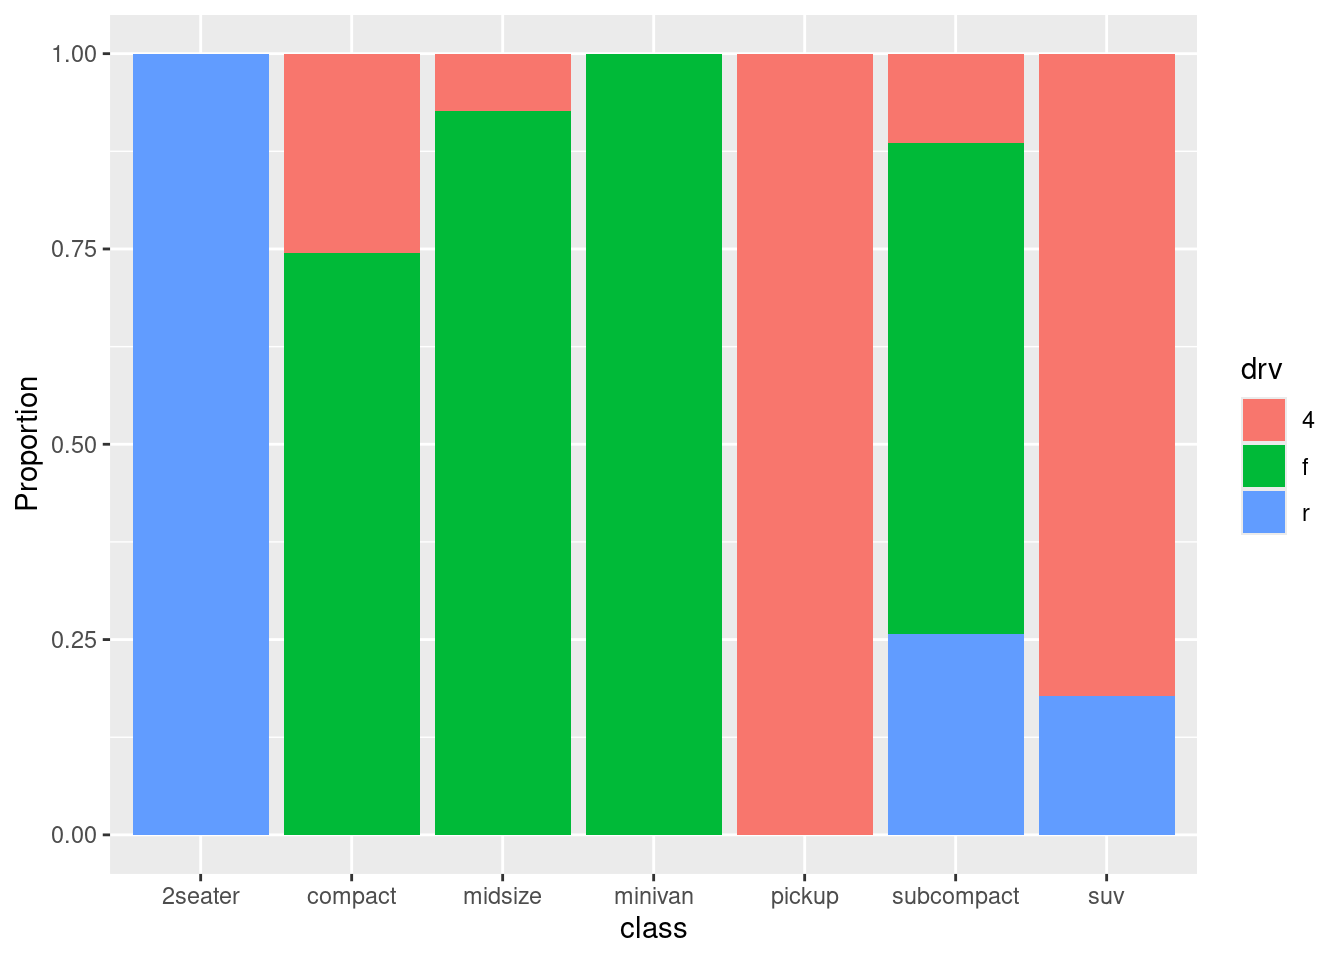
4.4 Segmented bar chart
A segmented bar plot is a stacked bar plot where each bar represents 100 percent. You can create a segmented bar chart using the position = “filled” option.
library(ggplot2)

# bar plot, with each bar representing 100%
ggplot(mpg,
       aes(x = class,
           fill = drv)) +
  geom_bar(position = "fill") +
  labs(y = "Proportion")