7.16 Area Charts
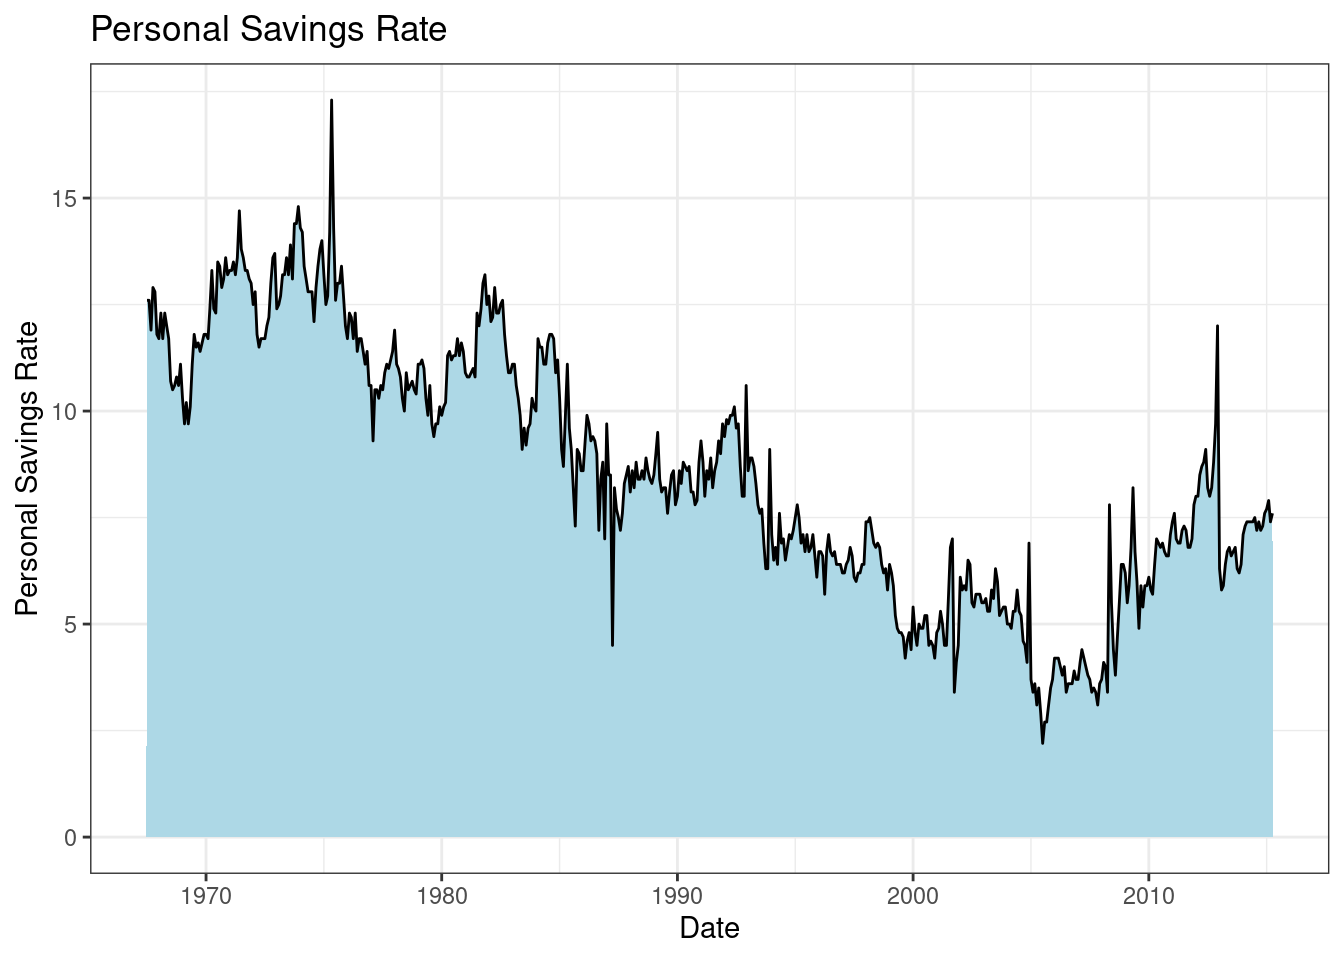
Area Charts is basically a line graph, with a fill from the line to the x-axis.
geom_area()is a function used to create an area plot. It is similar to a line plot, but instead of connecting the data points with a line, it fills in the area under the line.
# basic area chart

ggplot(economics, aes(x = date, y = psavert)) +
  geom_area(fill="lightblue", color="black") +
  labs(title = "Personal Savings Rate",
       x = "Date",
       y = "Personal Savings Rate")