2.4 Geometries Layer
The next essential element for data visualization is the geometries layer or geom layer for short.
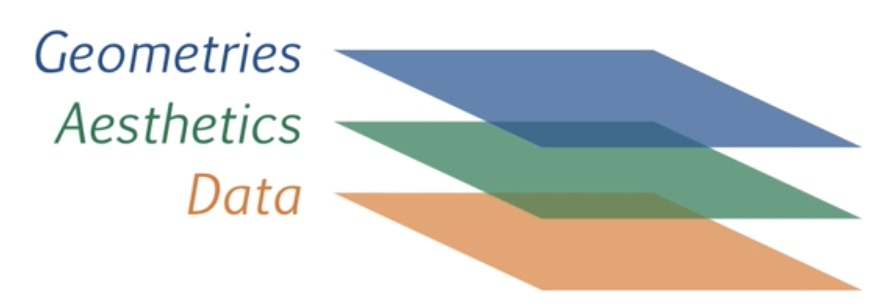
- Geoms are the geometric objects (points, lines, bars, etc.) that can be placed on a graph.
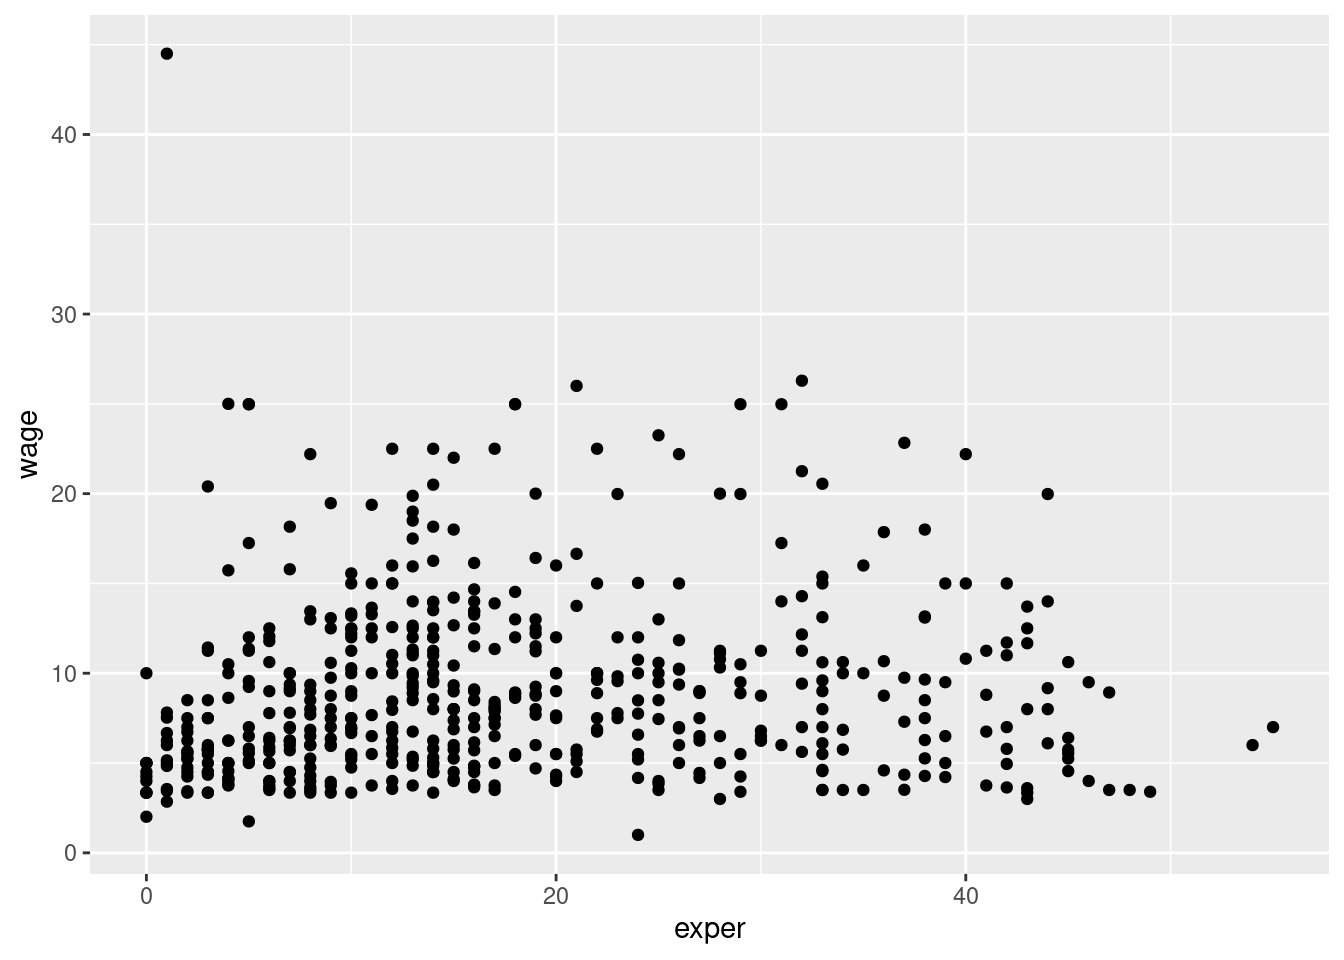
# delete outlier
library(dplyr)
plotdata <- filter(CPS85, wage < 40)

# redraw scatterplot
ggplot(data = plotdata,
       mapping = aes(x = exper, y = wage)) +
  geom_point()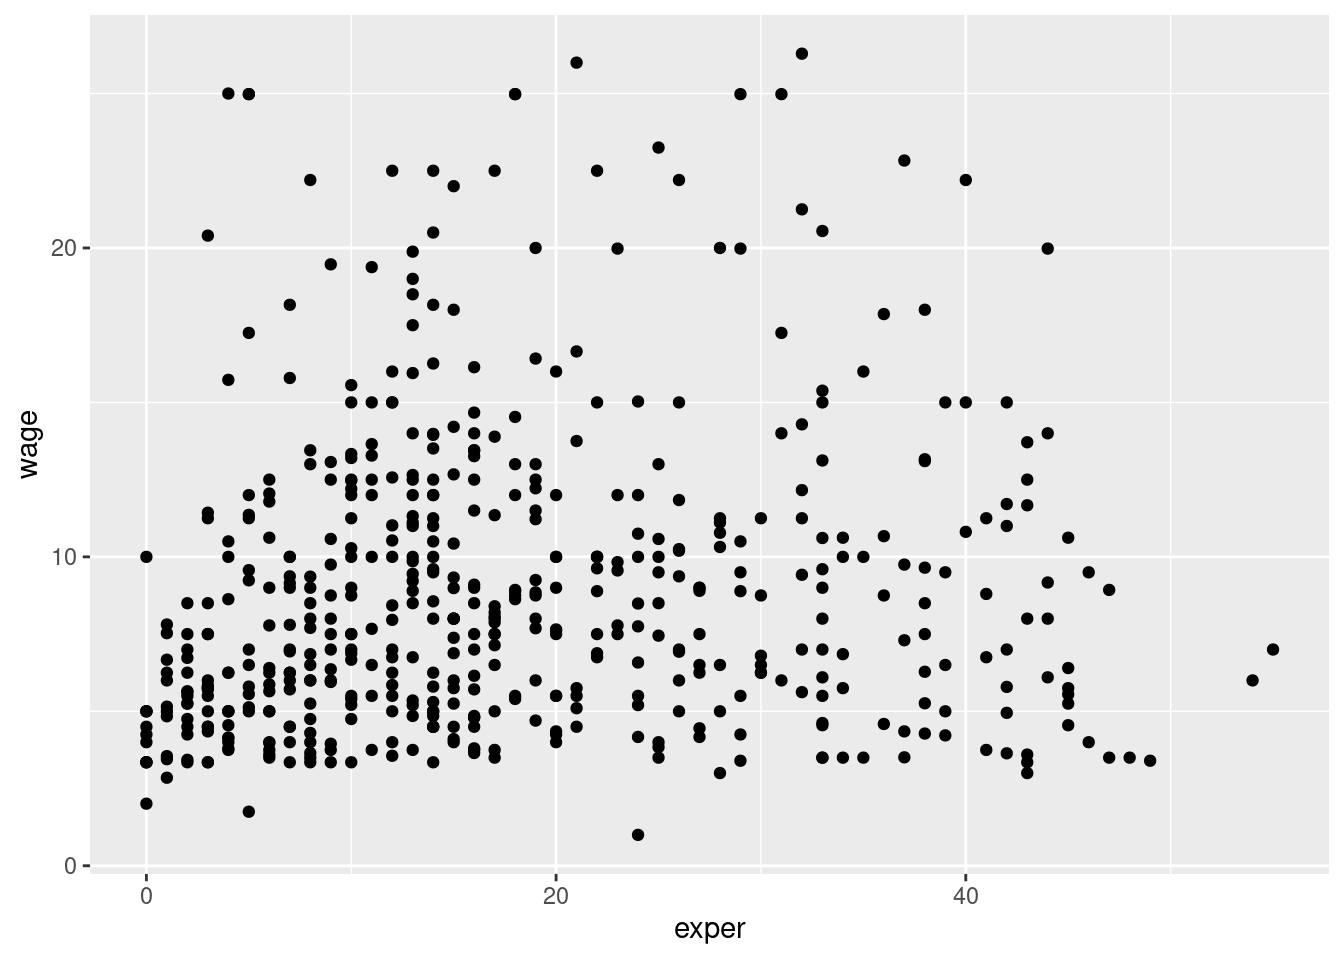
# make points blue, larger, and semi-transparent
ggplot(data = plotdata,
       mapping = aes(x = exper, y = wage)) +
  geom_point(color = "cornflowerblue",
             alpha = .7,
             size = 3)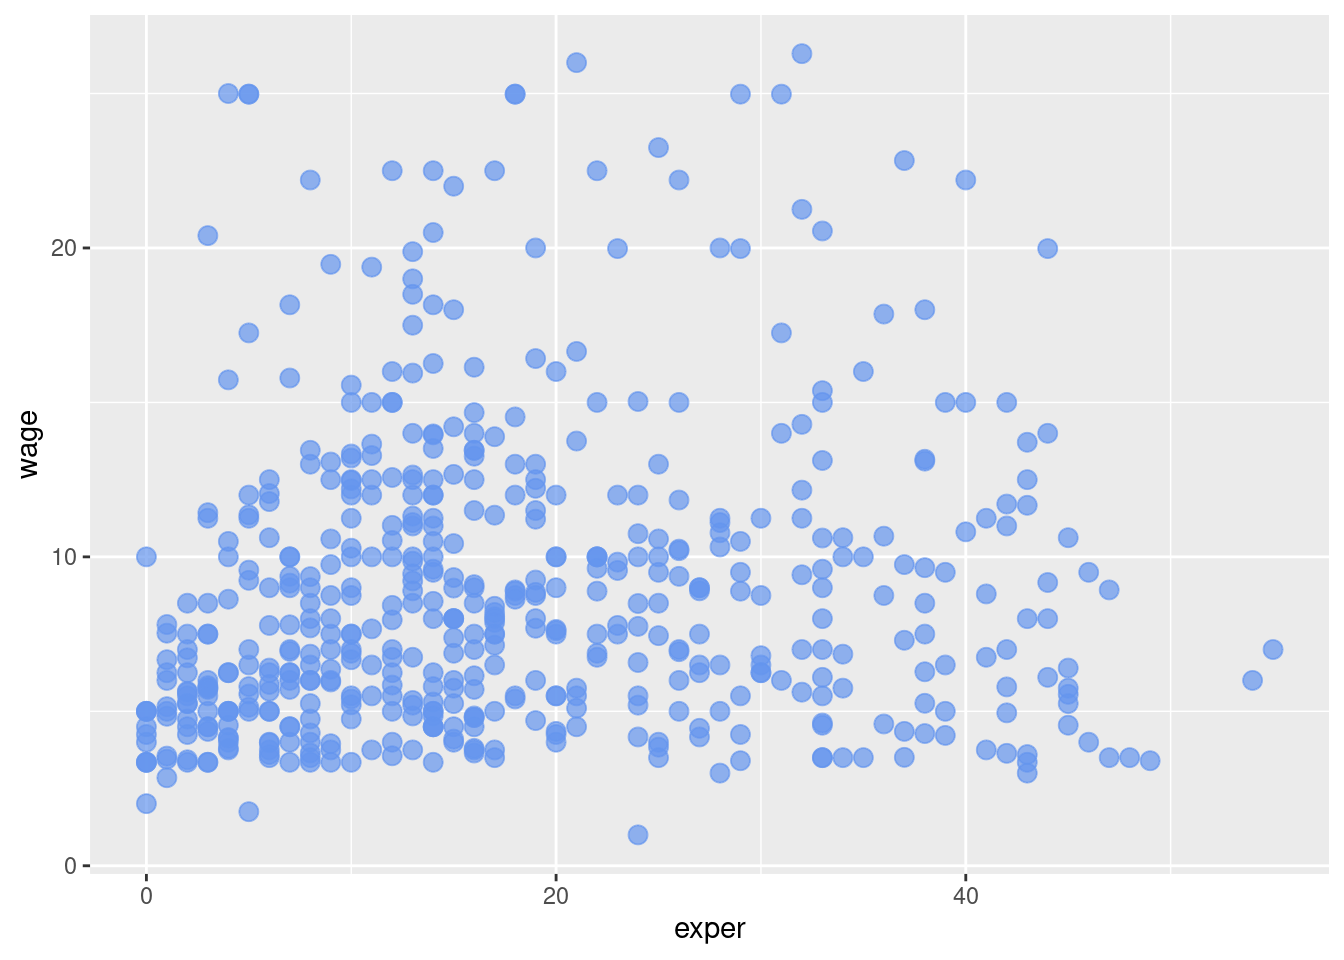
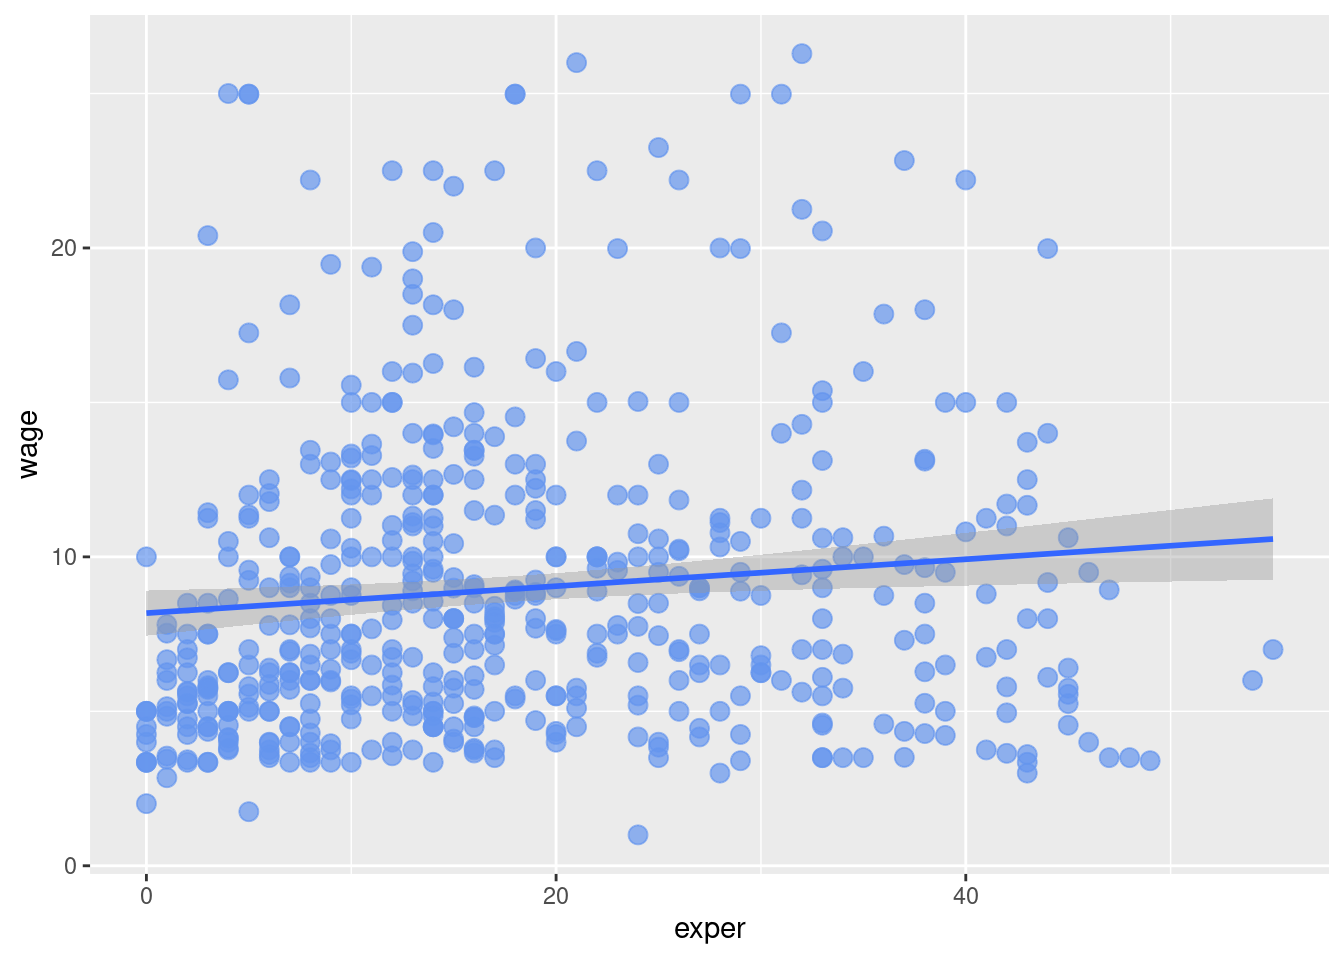
# add a line of best fit.
ggplot(data = plotdata,
       mapping = aes(x = exper, y = wage)) +
  geom_point(color = "cornflowerblue",
             alpha = .7,
             size = 3) +
  geom_smooth(method = "lm")