9.14 Heatmaps
A heatmap displays a set of data using colored tiles for each variable value within each observation.
Although base R comes with a
heatmapfunction, the author uses the more powerfulsuperheatpackage.The
superheatfunction requires that the data be in particular format. Specifically (1) the data most be all numeric, (2) the row names are used to label the left axis, and (3) missing values are allowed.
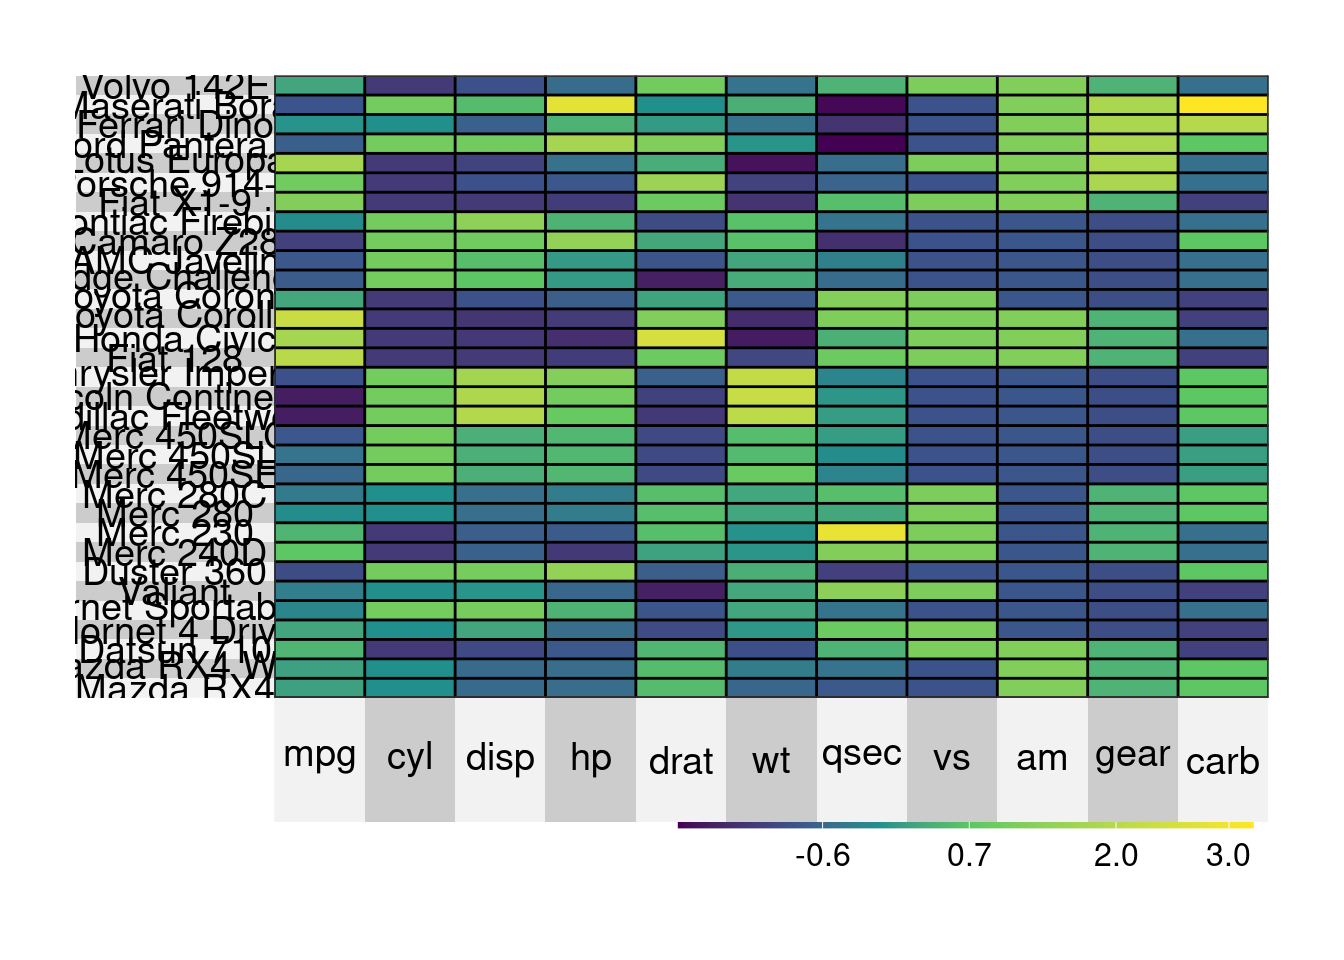
- The
scale = TRUEoptions standardizes the columns to a mean of zero and standard deviation of one.