9.18 Basic Radar Chart
- In the below example, we’ll use Mammal Sleep data to compare dogs, pigs, and cows in terms of body size, brain size, and sleep characteristics (total sleep time, length of sleep cycle, and amount of REM sleep). The data come from the
msleepdataset that ships withggplot2.
ggradar(plotdata,
        grid.label.size = 4,
        axis.label.size = 4,
        group.point.size = 5,
        group.line.width = 1.5,
        legend.text.size= 10) +
  labs(title = "Mammals, size, and sleep")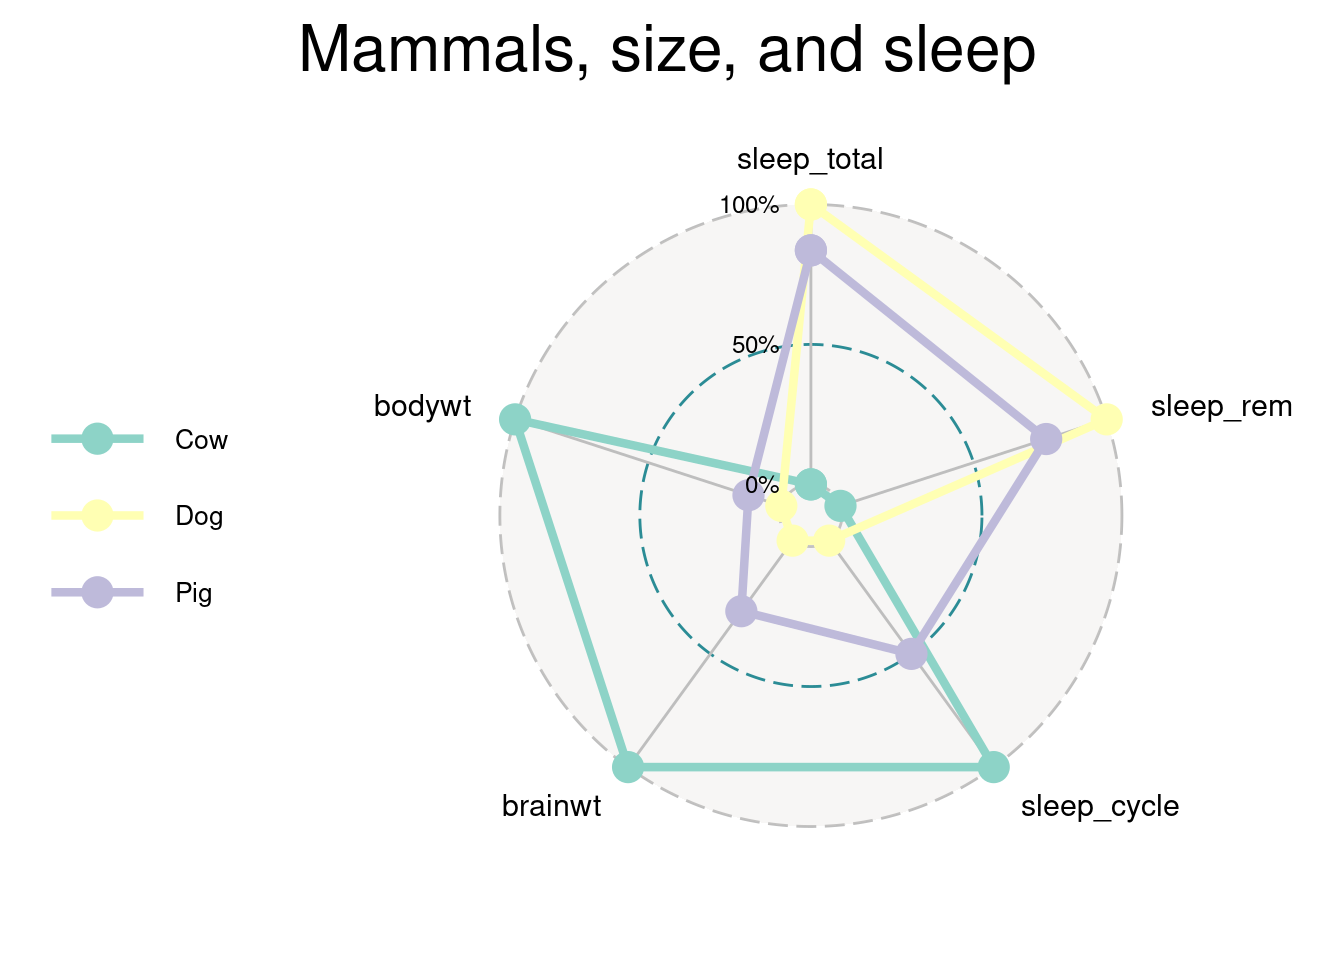
The
mutate_atfunction rescales all variables except group.The various
sizeoptions control the font sizes for the percent labels, variable names, point size, line width, and legend labels respectively.We can see from the chart that, (1) cows have large brain and body weights, long sleep cycles, short total sleep time and little time in REM sleep, where in comparison, (2) dogs have small body and brain weights, short sleep cycles, and a large total sleep time and time in REM sleep.