7.15 Slope Graphs
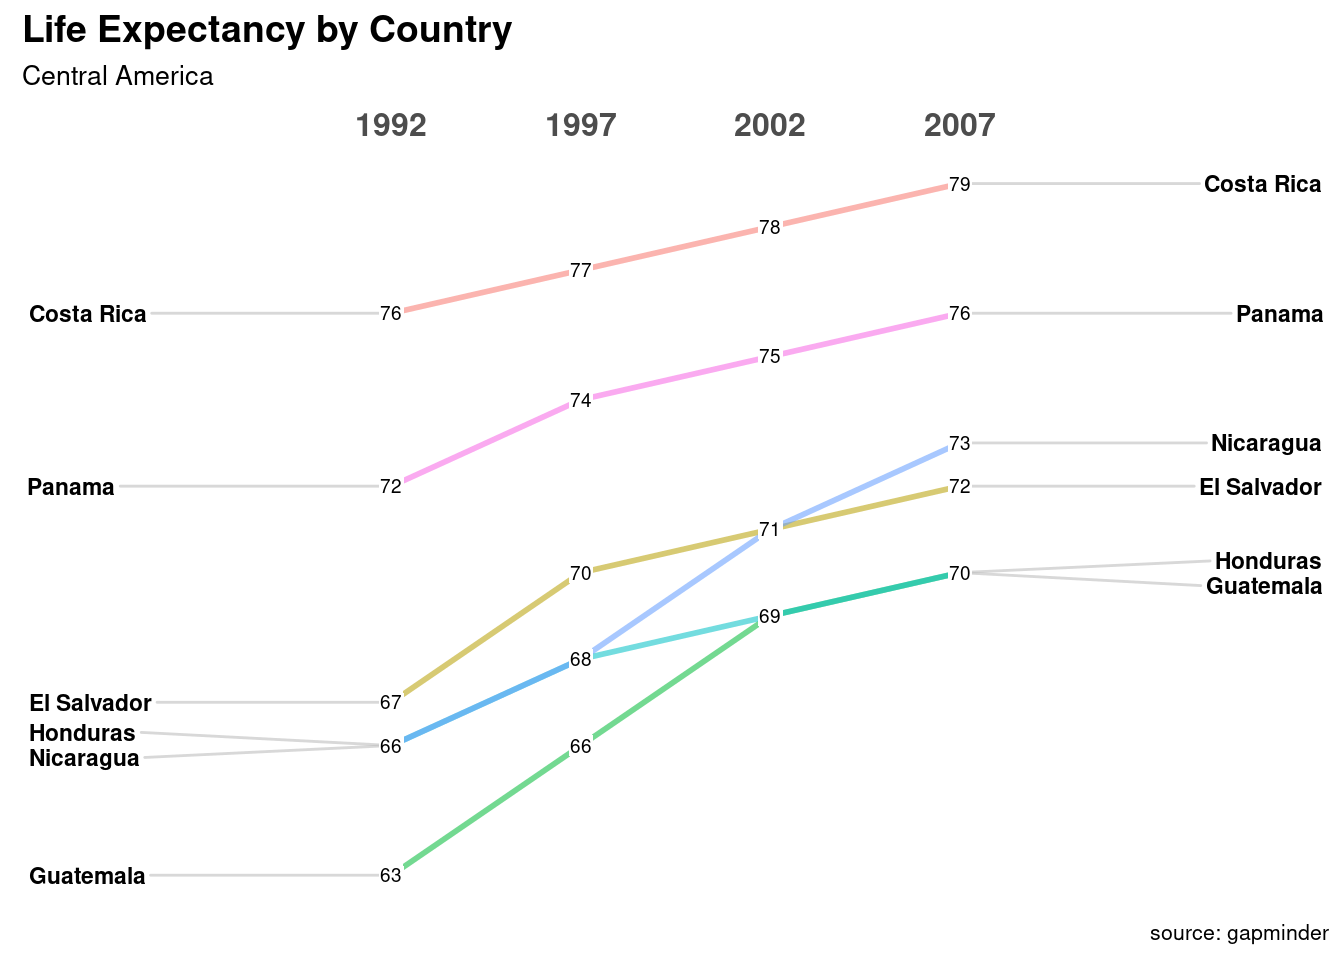
Let’s plot life expectancy for six Central American countries in 1992, 1997, 2002, and 2007.
# load library
library(CGPfunctions)

# Select Central American countries data
# for 1992, 1997, 2002, and 2007

df <- gapminder %>%
  filter(year %in% c(1992, 1997, 2002, 2007) &
           country %in% c("Panama", "Costa Rica",
                          "Nicaragua", "Honduras",
                          "El Salvador", "Guatemala",
                          "Belize")) %>%
  mutate(year = factor(year),
         lifeExp = round(lifeExp))

# create slope graph

newggslopegraph(df, year, lifeExp, country) +
  labs(title = "Life Expectancy by Country",
       subtitle = "Central America",
       caption = "source: gapminder")
##
## Converting 'year' to an ordered factor