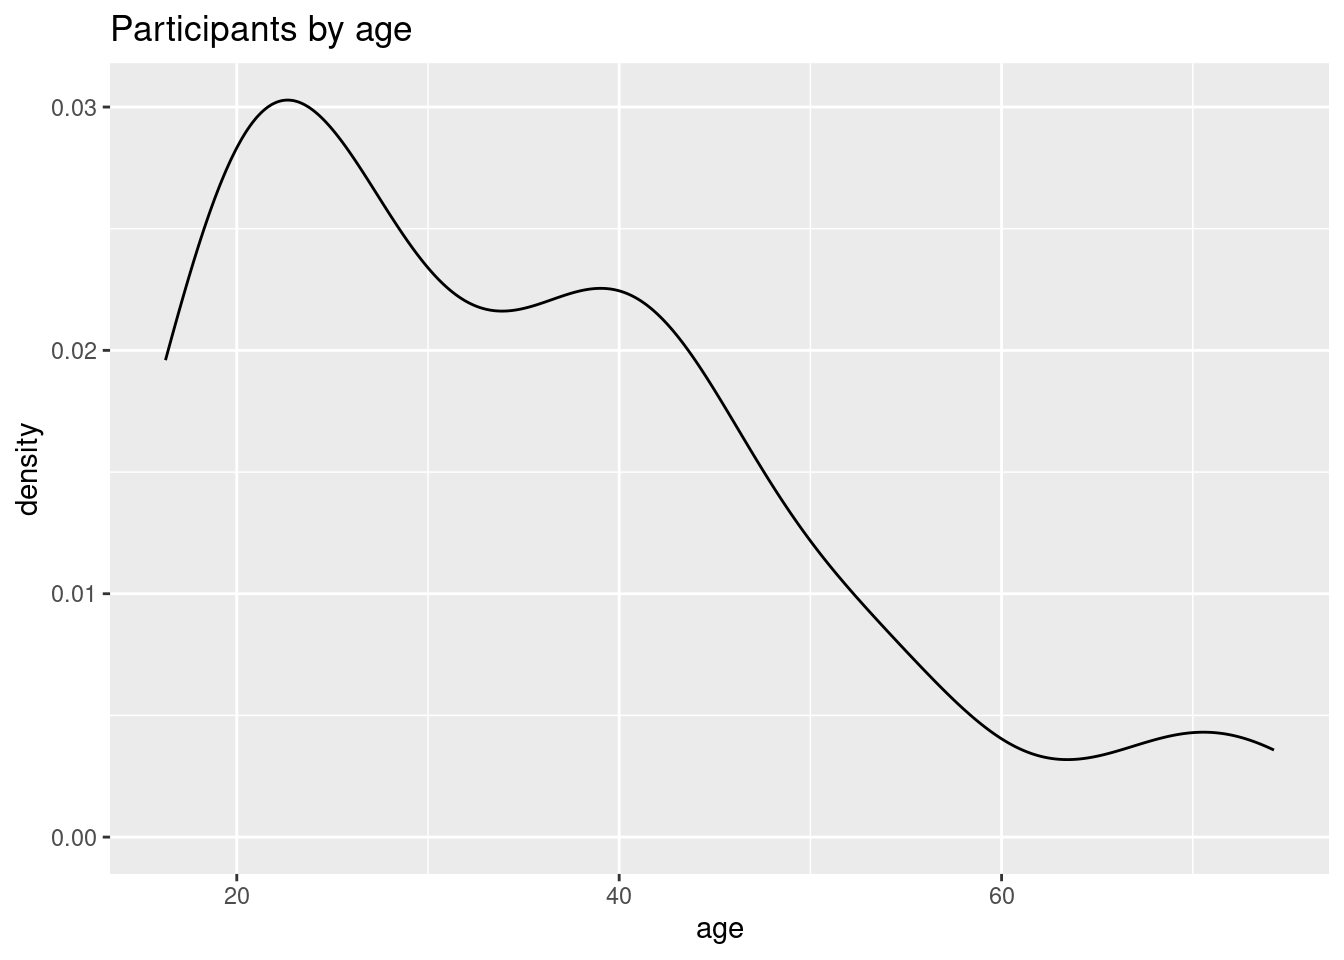
3.10 Kernel Density Plot
An alternative to a histogram, a density plot also shows the distribution of a single numeric variable.
# Create a kernel density plot of age
ggplot(Marriage, aes(x = age)) +
  geom_density() +
  labs(title = "Participants by age")