9.5 Biplots
A biplot is a specialized graph, useful in principal components analysis (PCA), that attempts to represent the relationship between observations, between variables, and between observations and variables, in a low (usually two) dimensional space.
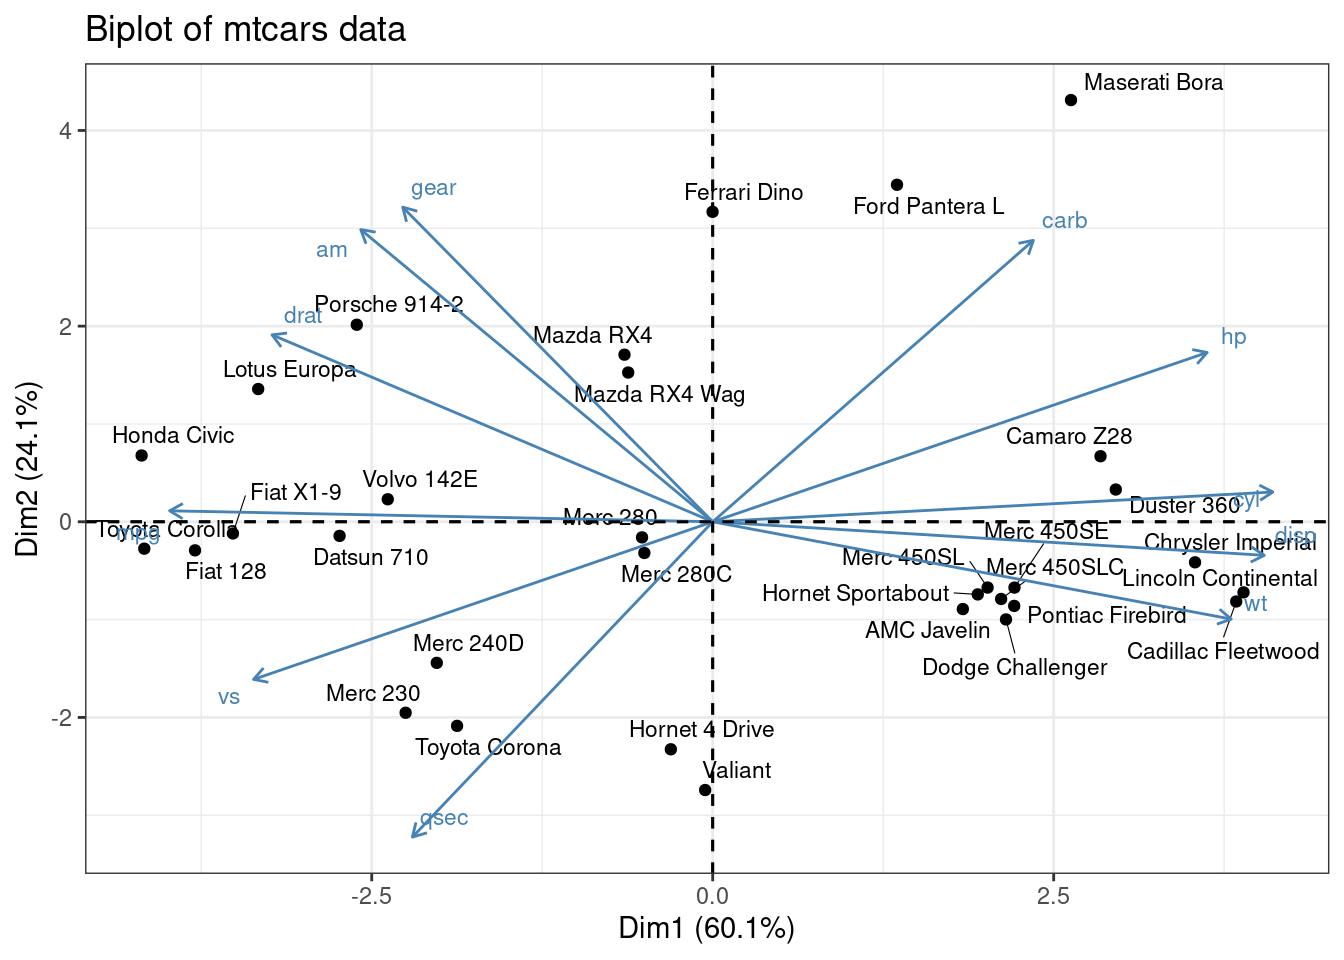
Here we create a biplot for the
mtcarsdataset, using thefviz_pcafunction from thefactoextrapackage to produce aggplot2graph.
data(mtcars) # load data

# fit a principal components model
fit <- prcomp(x = mtcars, center = TRUE, scale = TRUE)

# plot the results
library(factoextra)
fviz_pca(fit, repel = TRUE, labelsize = 3) +
  theme_bw() +
  labs(title = "Biplot of mtcars data")