4.13 Ridgeline plots
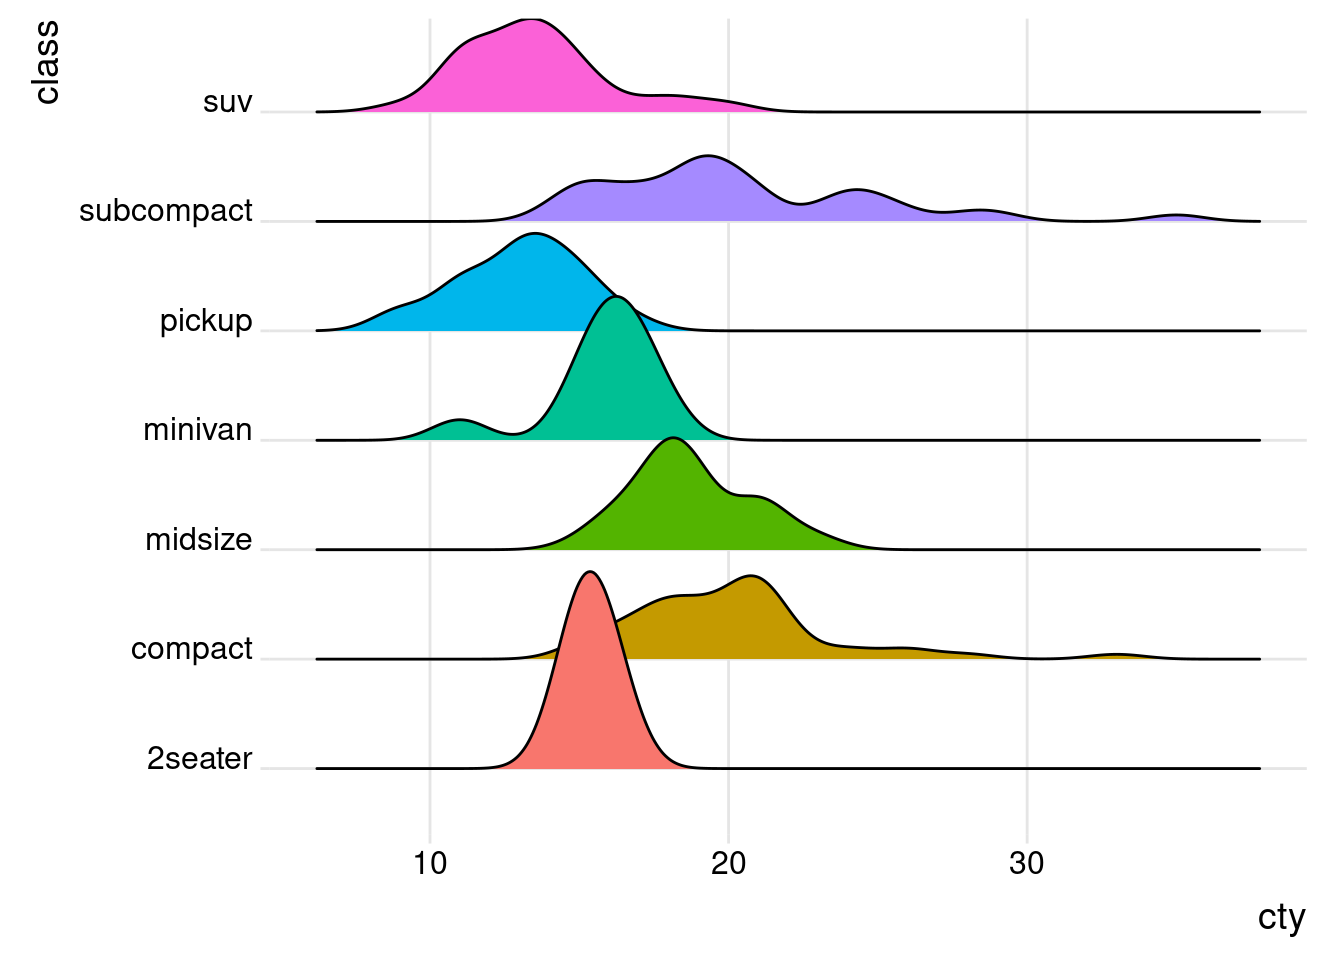
A ridgeline plot (also called a joyplot) displays the distribution of a quantitative variable for several groups. They’re similar to kernel density plots with vertical faceting, but take up less room. Ridgeline plots are created with the ggridges package.
# create ridgeline graph
library(ggplot2)
library(ggridges)

ggplot(mpg,
       aes(x = cty,
           y = class,
           fill = class)) +
  geom_density_ridges() +
  theme_ridges() +
  labs("Highway mileage by auto class") +
  theme(legend.position = "none")
## Picking joint bandwidth of 0.929