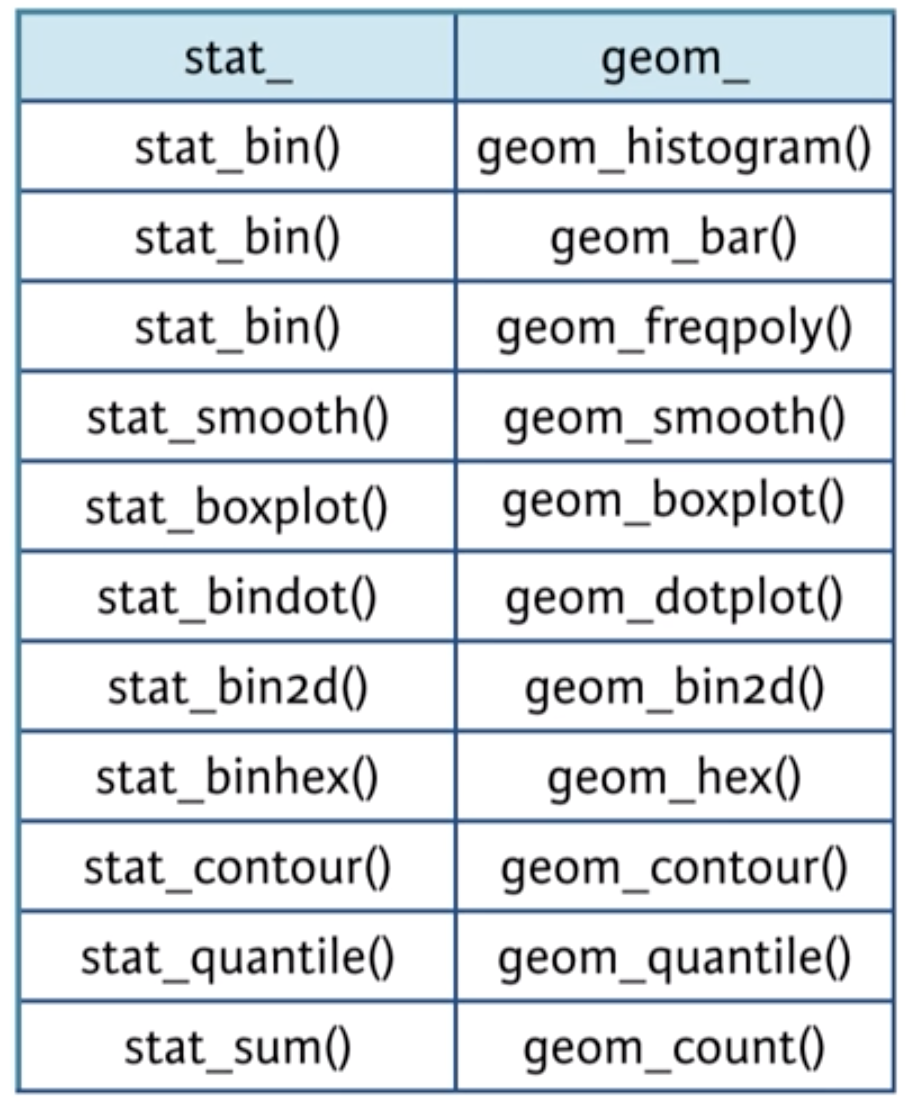
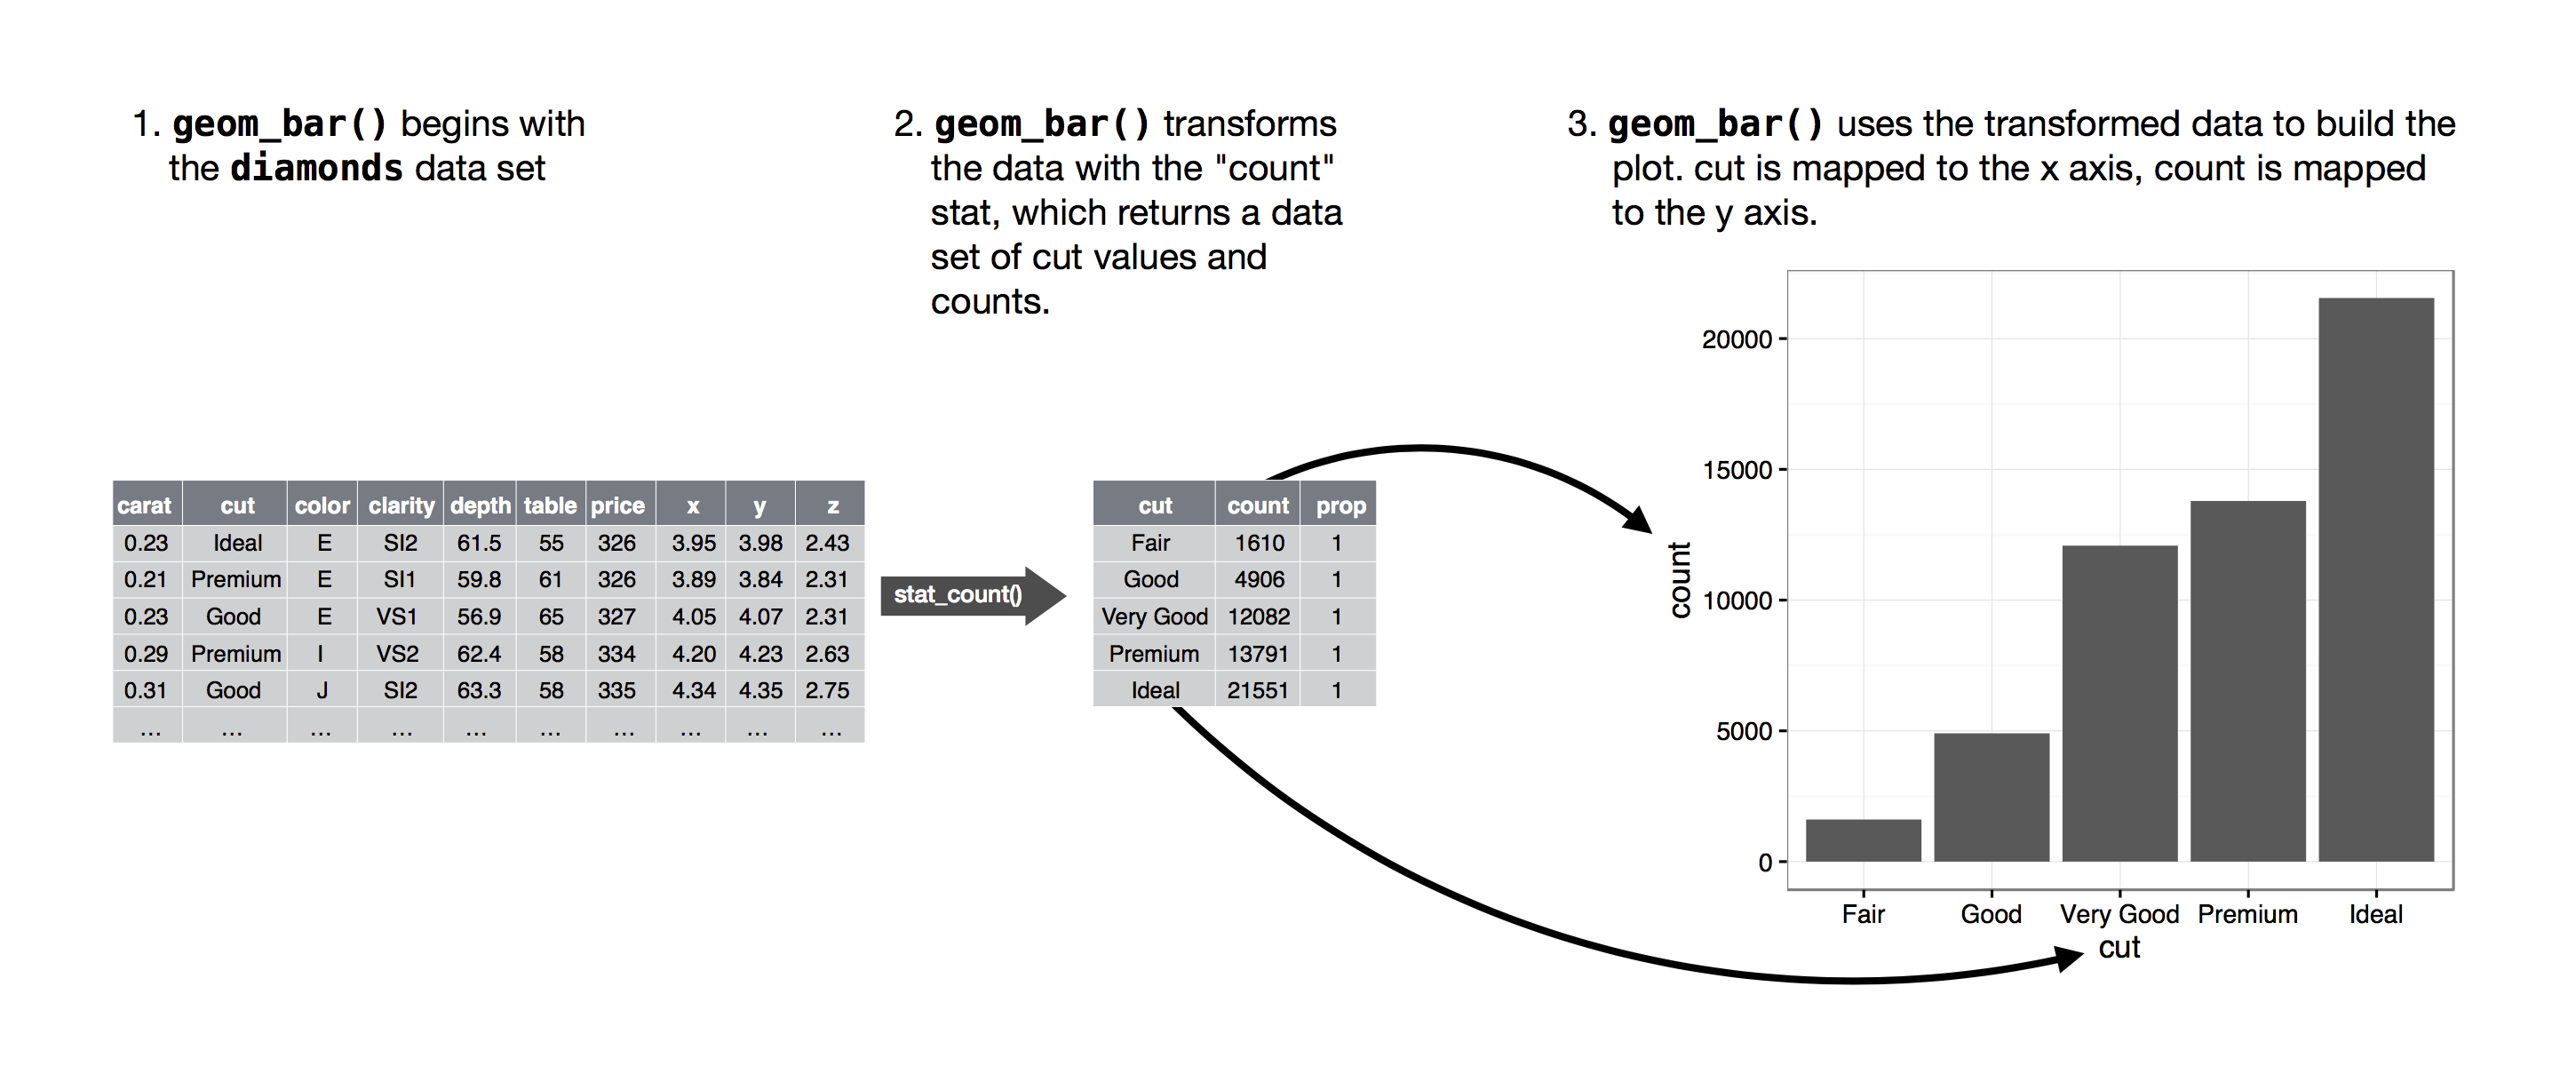
2.5 Statistics Layer
The statistics layer allows us to plot statistical values calculated from the data
This is used to transform the input variables to displayed values

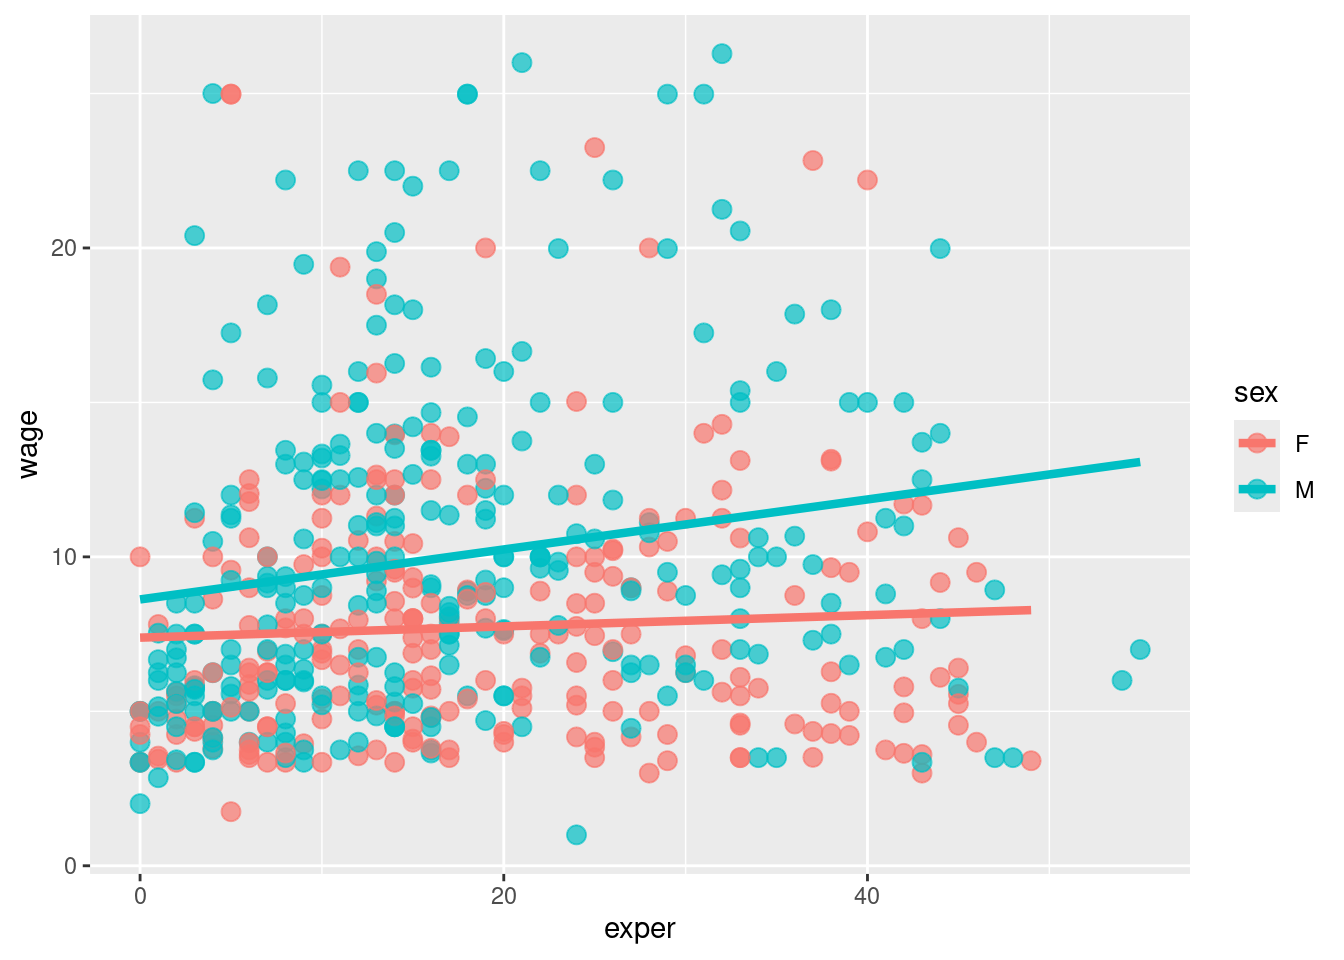
# indicate sex using color
ggplot(data = plotdata,
       mapping = aes(x = exper,
                     y = wage,
                     color = sex)) +
  geom_point(alpha = .7,
             size = 3) +
  geom_smooth(method = "lm",
              se = FALSE,
              size = 1.5)