6.2 Dot density maps
Dot density maps use points on a map to explore spatial relationships.
The Houston crime dataset contains the date, time, and address of six types of criminal offenses reported between January and August 2010.
library(ggmap)

# subset the data
library(dplyr)

rapes <- filter(crime, offense == "rape") %>%
  select(date, offense, address, lon, lat)

# view data
head(rapes)
## date offense address lon lat
## 1 1/1/2010 rape 5950 glenmont dr -95.48498 29.72007
## 2 1/1/2010 rape 2350 sperber ln -95.34817 29.75505
## 3 1/1/2010 rape 5850 mackinaw rd -95.47353 29.60021
## 4 1/1/2010 rape 5850 southwest fwy -95.48174 29.72603
## 5 1/2/2010 rape 7550 corporate dr -95.55224 29.69836
## 6 1/2/2010 rape 1150 fidelity st -95.25535 29.74147- Find the center coordinates for Houston, TX
Get the background map image.
Specify a zoom factor from 3 (continent) to 21 (building). The default is 10 (city).
Specify a map type. Types include terrain, terrain-background, satellite, roadmap, hybrid, watercolor, and toner.
# get Houston map

houston_map <- get_map(houston_center,
                       zoom = 13,
                       maptype = "roadmap")

ggmap(houston_map)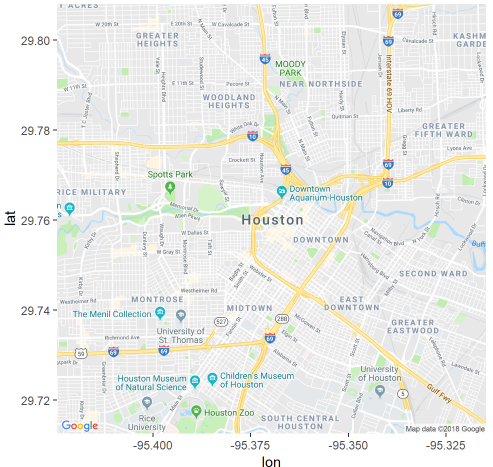
- Add crime locations to the map.
# add incident locations
ggmap(houston_map,
      base_layer = ggplot(data = rapes,
                          aes(x=lon, y = lat))) +
  geom_point(color = "red",
             size = 3,
             alpha = 0.5)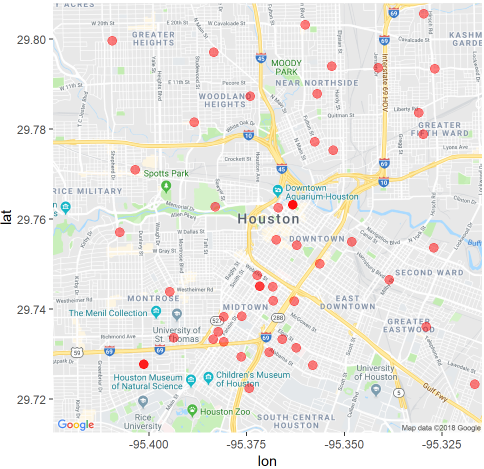
- Clean up the plot and add labels.
# remove long and lat numbers and add titles
ggmap(houston_map,
      base_layer = ggplot(aes(x=lon, y = lat),
                          data = rapes)) +
  geom_point(color = "red",
             size = 3,
             alpha = 0.5) +
  theme_void() +
  labs(title = "Location of reported rapes",
       subtitle = "Houston Jan - Aug 2010",
       caption = "source: http://www.houstontx.gov/police/cs/")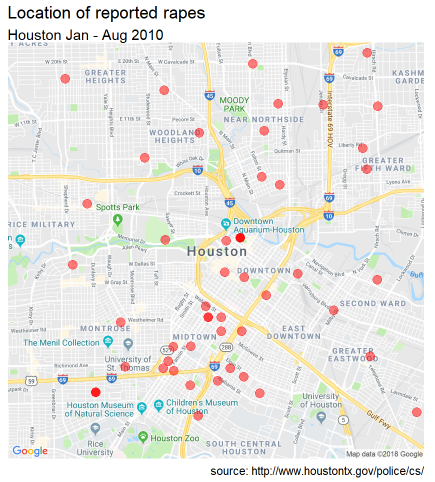
To learn more about ggmap, see ggmap: Spatial Visualization with ggplot2.