4.7 Adding best fit lines
It is often useful to summarize the relationship displayed in the scatterplot, using a best fit line. Many types of lines are supported, including linear, polynomial, and nonparametric (loess). By default, 95% confidence limits for these lines are displayed.
# scatterplot with linear fit line
ggplot(Salaries,
       aes(x = yrs.since.phd,
           y = salary)) +
  geom_point(color= "steelblue") +
  geom_smooth(method = "lm")
## `geom_smooth()` using formula = 'y ~ x'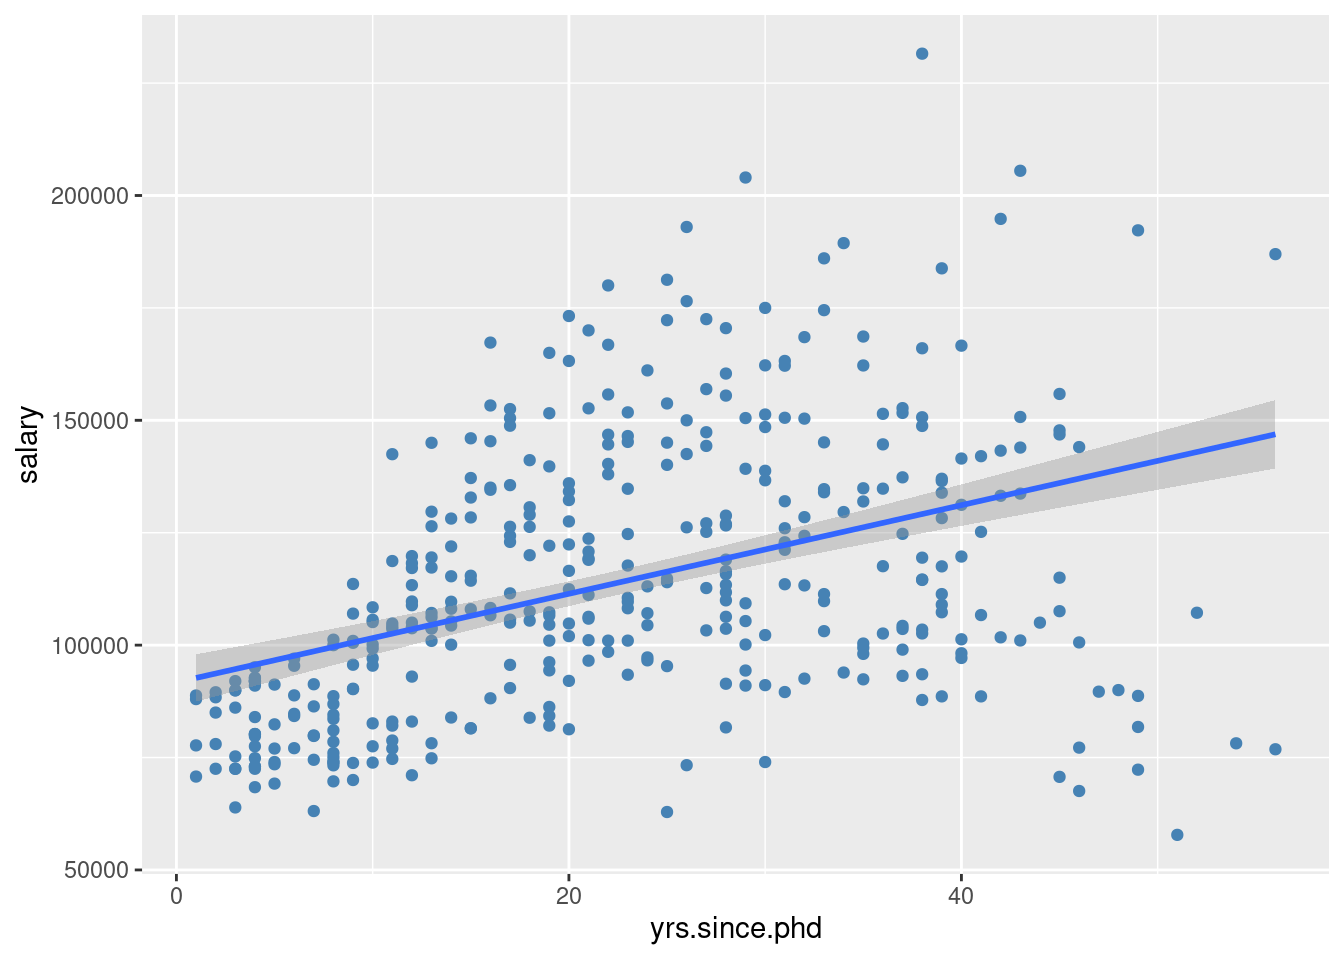
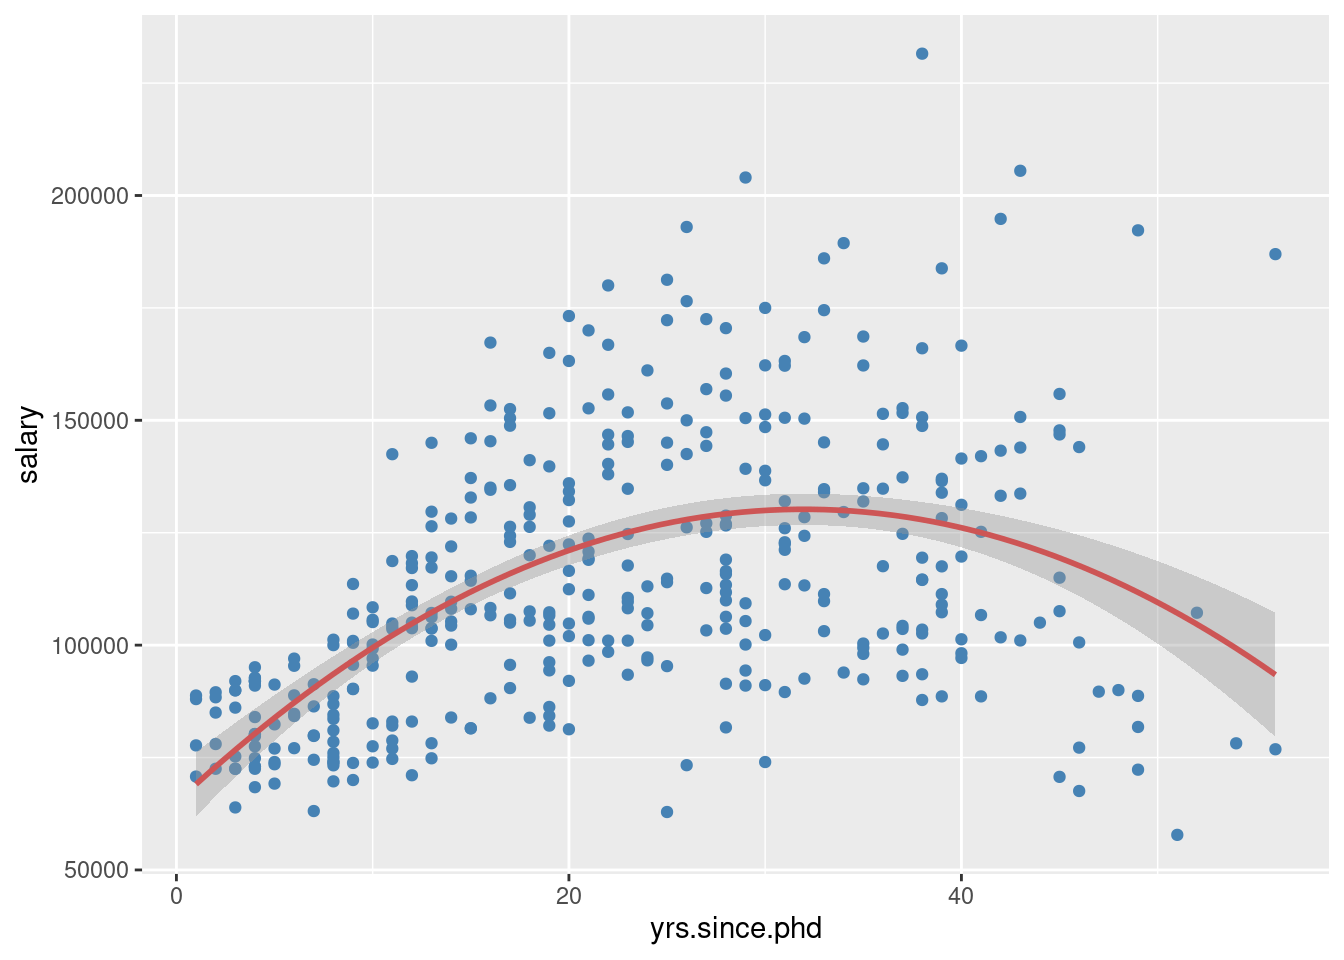
# scatterplot with quadratic line of best fit
ggplot(Salaries,
       aes(x = yrs.since.phd,
           y = salary)) +
  geom_point(color= "steelblue") +
  geom_smooth(method = "lm",
              formula = y ~ poly(x, 2),
              color = "indianred3")