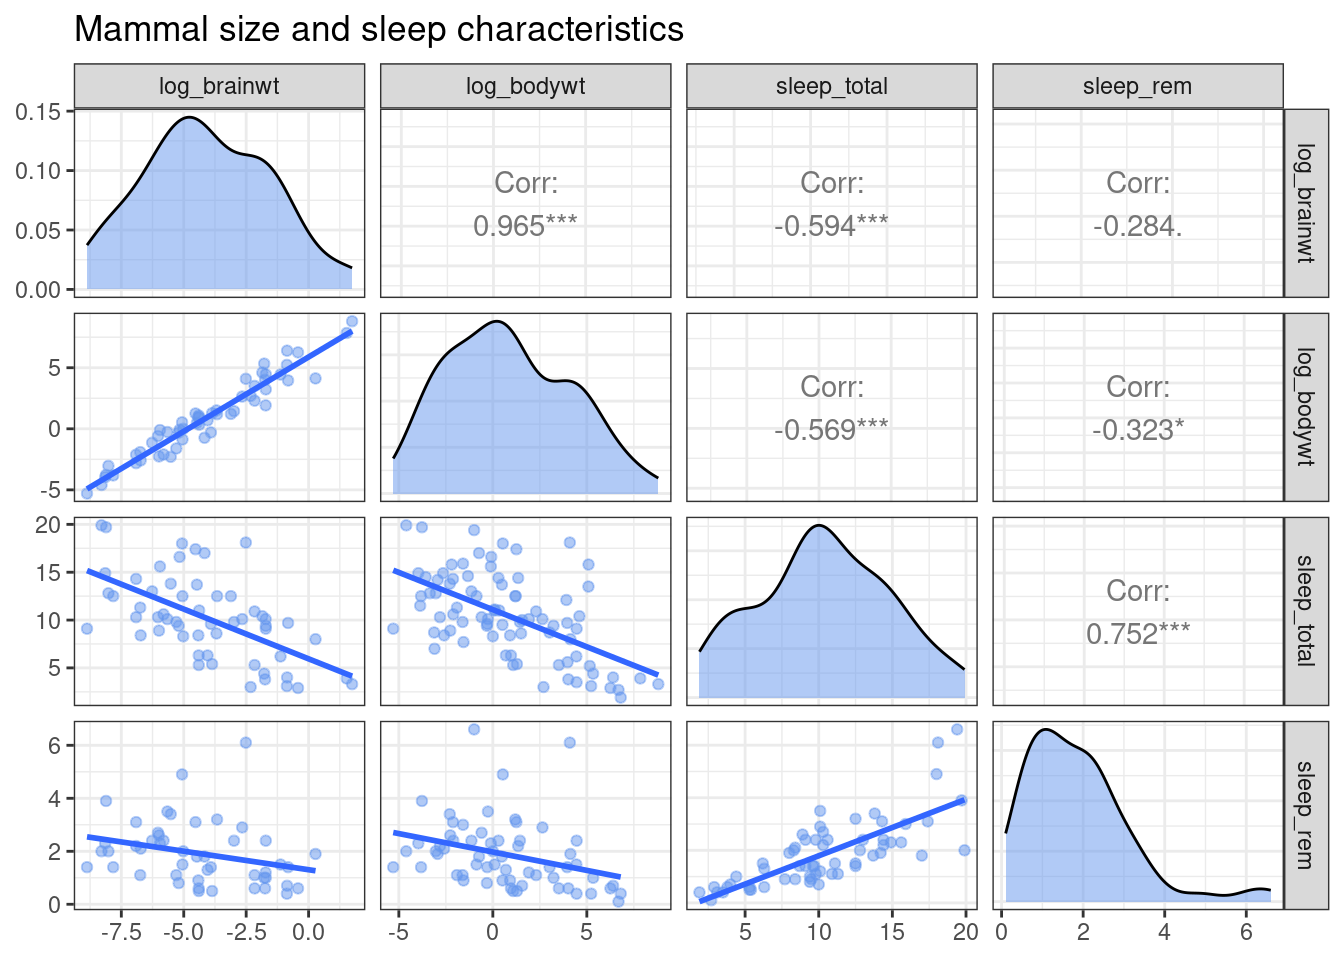
9.20 Customized Scaterplot Matrix
Since ggpairs creates a ggplot2 graph, additional functions can be added to alter the theme, title, labels, etc.
# custom function for density plot
my_density <- function(data, mapping, ...){
  ggplot(data = data, mapping = mapping) +
    geom_density(alpha = 0.5,
                 fill = "cornflowerblue", ...)}

# custom function for scatterplot
my_scatter <- function(data, mapping, ...){
  ggplot(data = data, mapping = mapping) +
    geom_point(alpha = 0.5,
               color = "cornflowerblue") +
    geom_smooth(method=lm,
                se=FALSE, ...)}

# create scatterplot matrix
ggpairs(df,
        lower=list(continuous = my_scatter),
        diag = list(continuous = my_density)) +
  labs(title = "Mammal size and sleep characteristics") +
  theme_bw()