7.5 Modified Simple Line Plot
# load library
library(ggplot2)
library(scales)
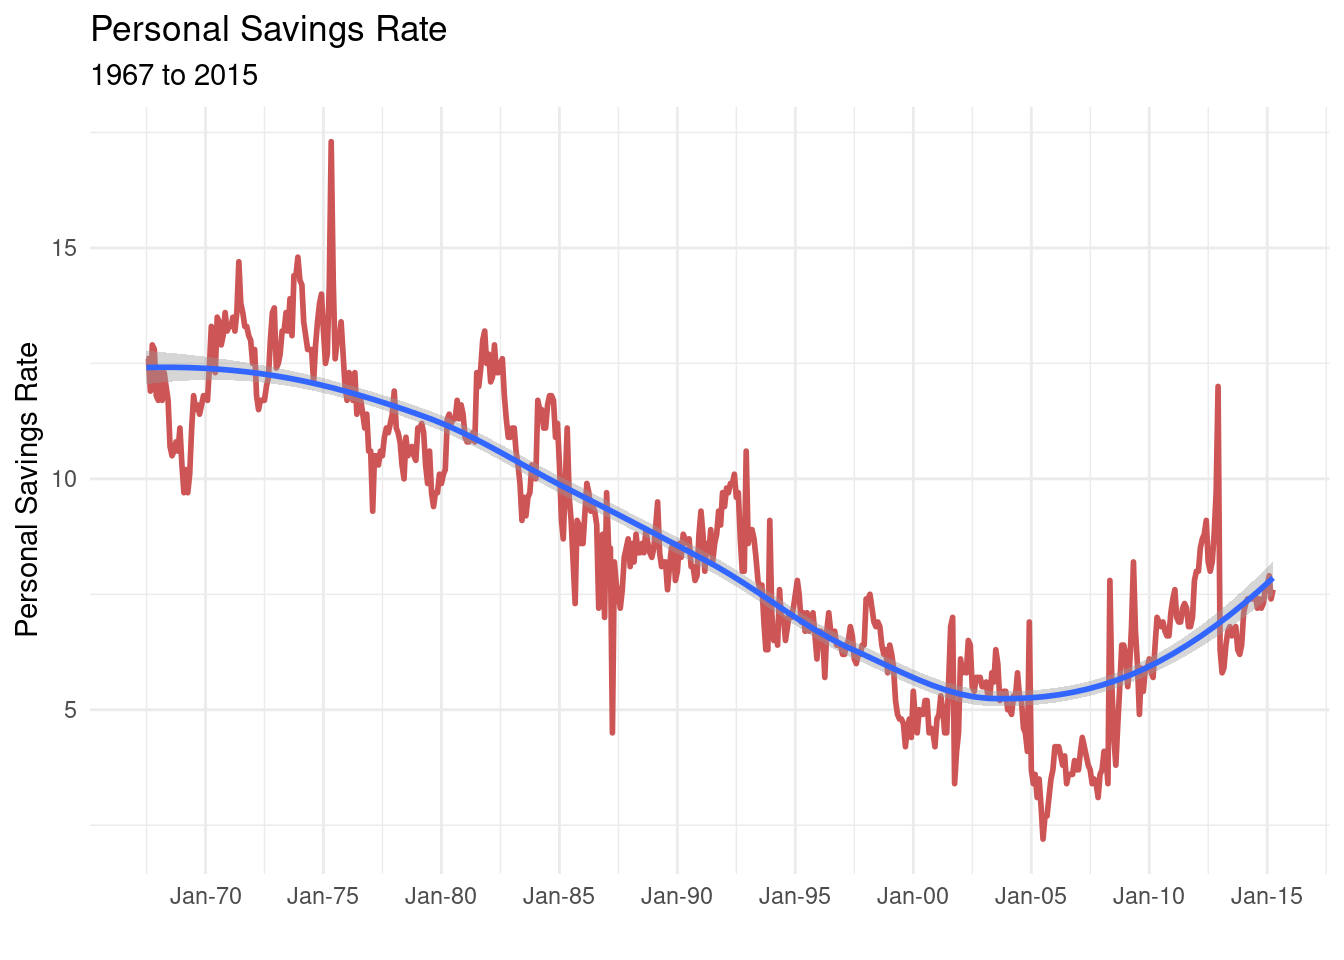
ggplot(economics, aes(x = date, y = psavert)) +
geom_line(color = "indianred3",
size=1 ) +
geom_smooth() +
scale_x_date(date_breaks = '5 year',
labels = date_format("%b-%y")) +
labs(title = "Personal Savings Rate",
subtitle = "1967 to 2015",
x = "",
y = "Personal Savings Rate") +
theme_minimal()