8.13 Survival Plots using ggsurvplot
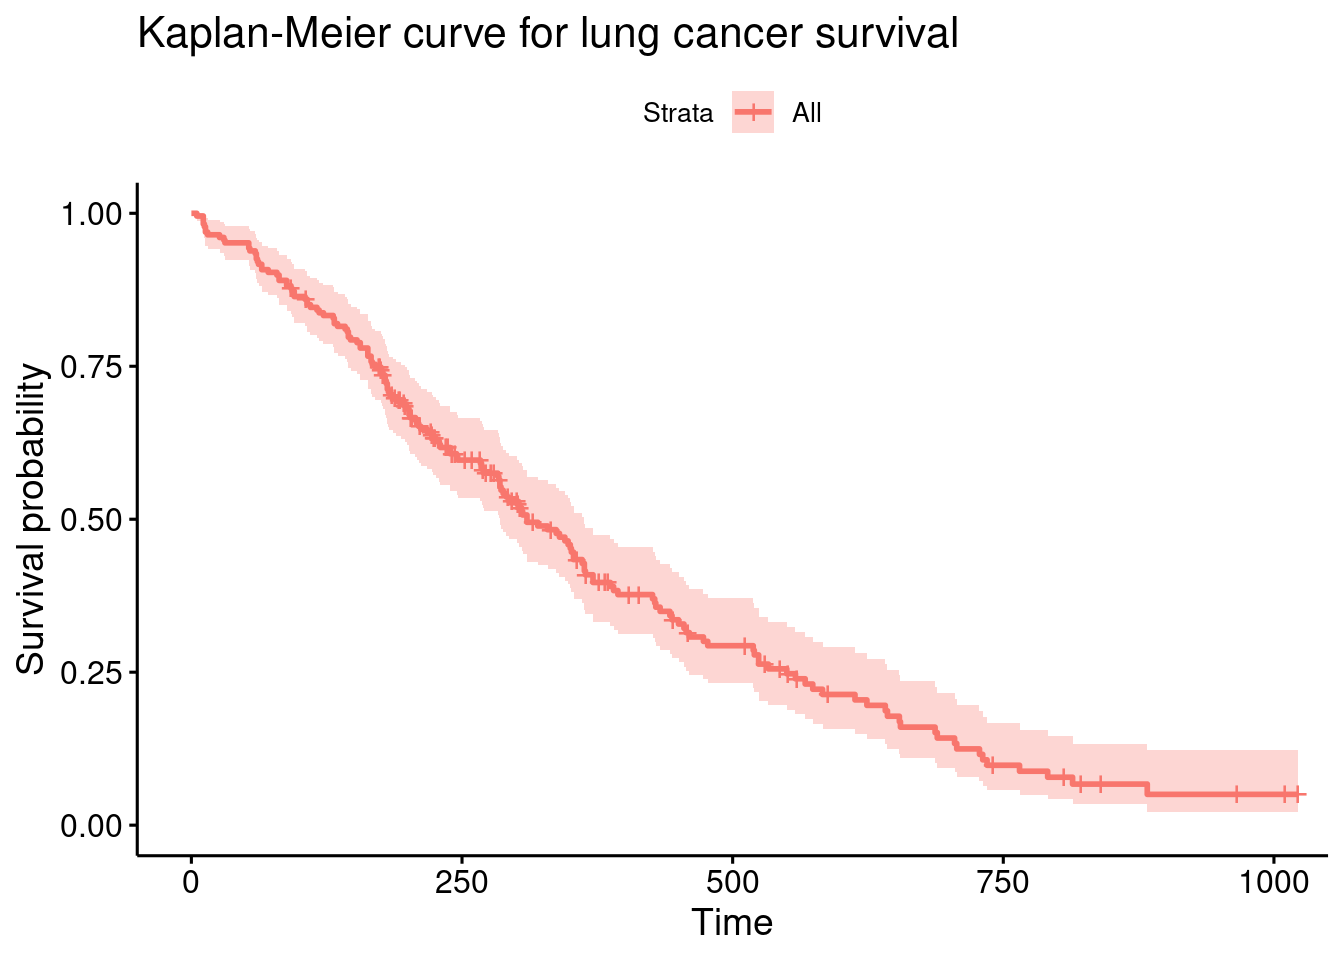
- A survival plot (also called a Kaplan-Meier Curve) can be used to illustrates the probability that an individual survives up to and including time t.
# plot survival curve
library(survival)
library(survminer)

data(lung)
sfit <- survfit(Surv(time, status) ~  1, data=lung)
ggsurvplot(sfit,
title="Kaplan-Meier curve for lung cancer survival") 
Roughly 50% of patients are still alive 300 days post treatment.
We can run
summary(sfit)for more details.