8.14 Comparing survival probabilities
It is frequently of great interest whether groups of patients have the same survival probabilities.
In this graph, the survival curve for men and women are compared.
# plot survival curve for men and women
sfit <- survfit(Surv(time, status) ~  sex, data=lung)
ggsurvplot(sfit,
           conf.int=TRUE,
           pval=TRUE,
           legend.labs=c("Male", "Female"),
           legend.title="Sex",
           palette=c("cornflowerblue", "indianred3"),
           title="Kaplan-Meier Curve for lung cancer survival",
           xlab = "Time (days)")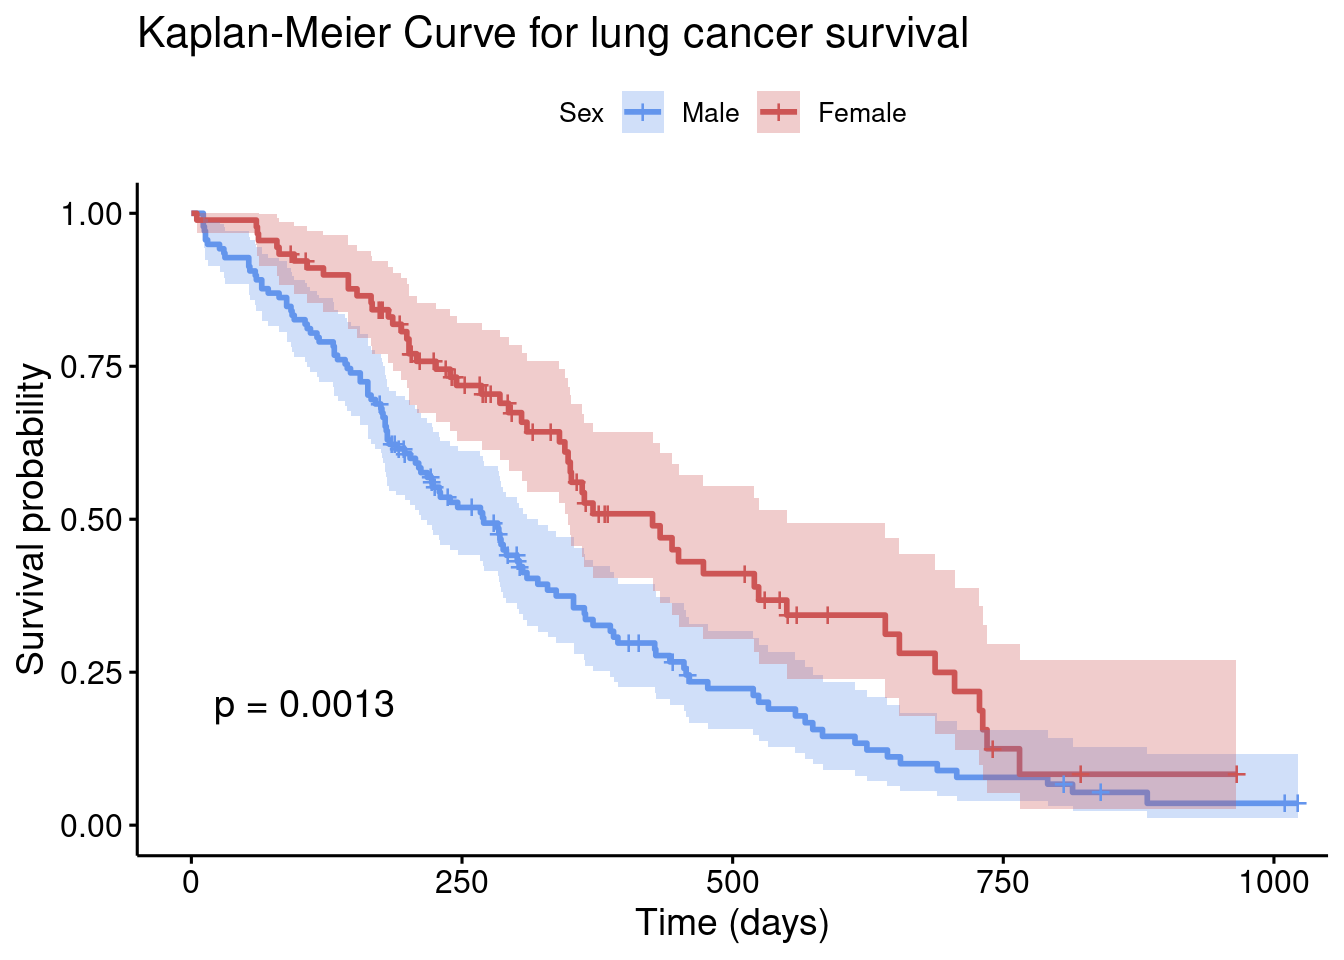
A couple
ggsurvplotoptions: (1)conf.intprovides confidence intervals, (2)pvalprovides a log-rank test comparing the survival curves.The p-value (0.0013) provides strong evidence that men and women have different survival probabilities following treatment.