9.1 3-D Scatterplot
Since the
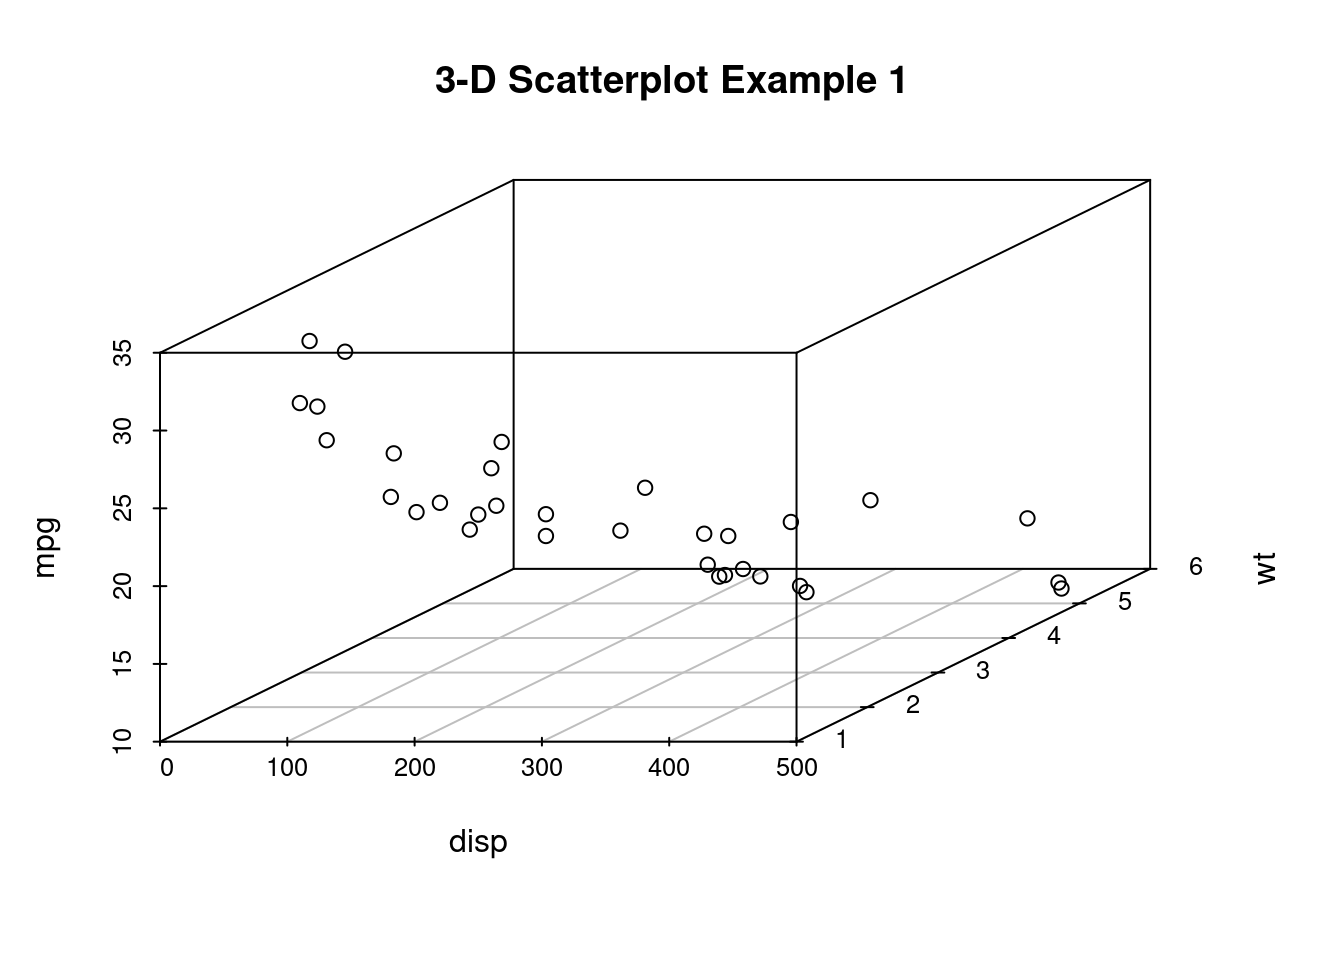
ggplot2package and its extensions can’t create a 3-D plot, you can create a 3-D scatterplot with thescatterplot3dfunction in thescatterplot3dpackage.Let’s plot automobile mileage vs. engine displacement vs. car weight using the data in the
mtcarsdataframe –mtcarscomes with base R and contains information on 32 cars measured on 11 variables.
library(scatterplot3d)
with(mtcars, {
   scatterplot3d(x = disp,
                 y = wt,
                 z = mpg,
                 main = "3-D Scatterplot Example 1")
})