7.19 Stacked Area Chart
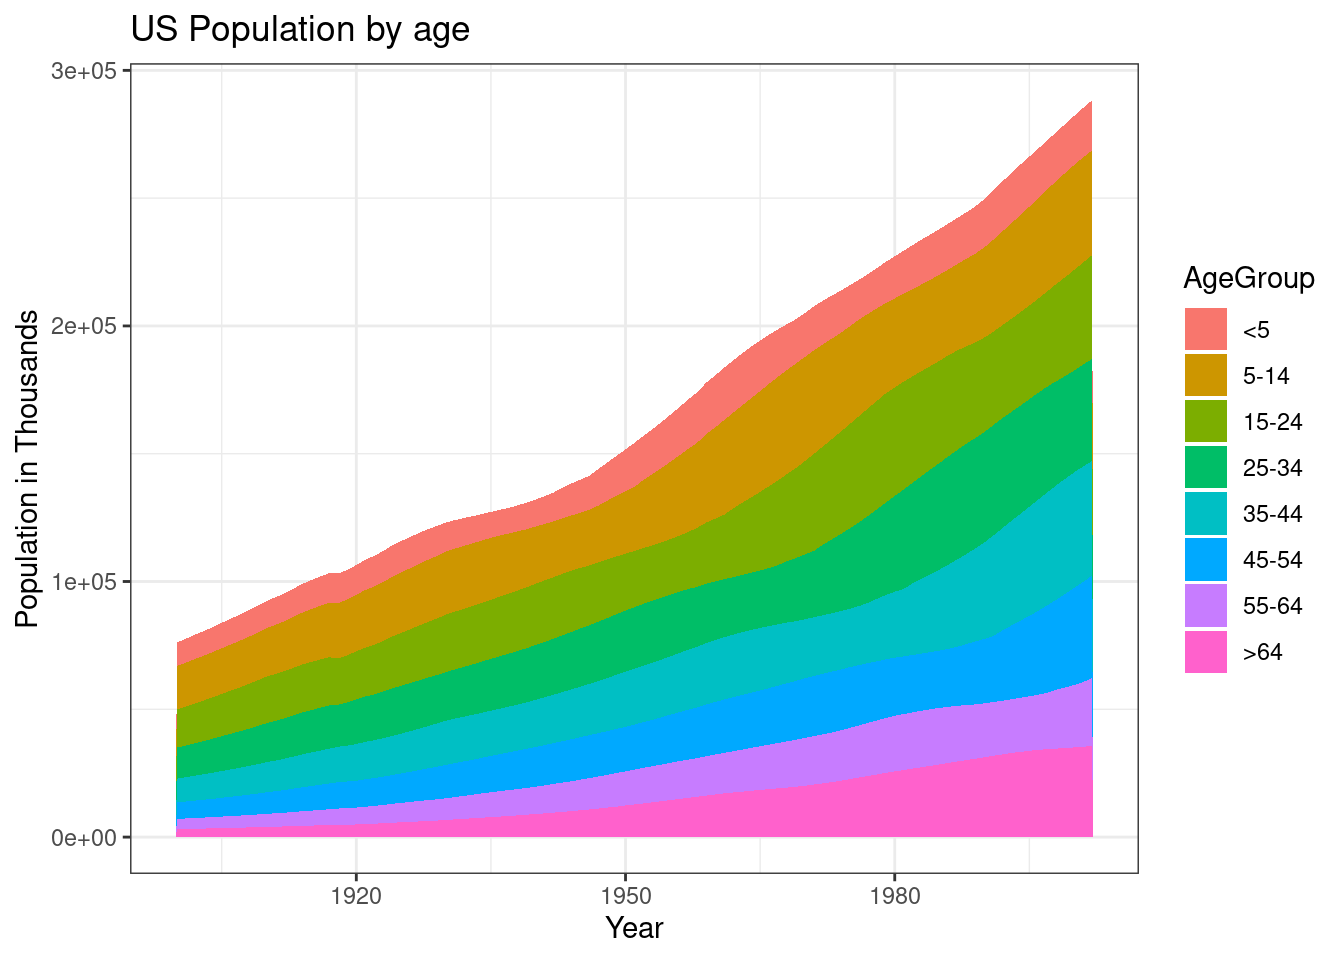
Let’s plot the age distribution of the US population from 1900 and 2002.
# stacked area chart

# load data
data(uspopage, package = "gcookbook")

ggplot(uspopage, aes(x = Year,
                     y = Thousands,
                     fill = AgeGroup)) +
  geom_area() +
  labs(title = "US Population by age",
       x = "Year",
       y = "Population in Thousands")