9.19 Scaterplot Matrix
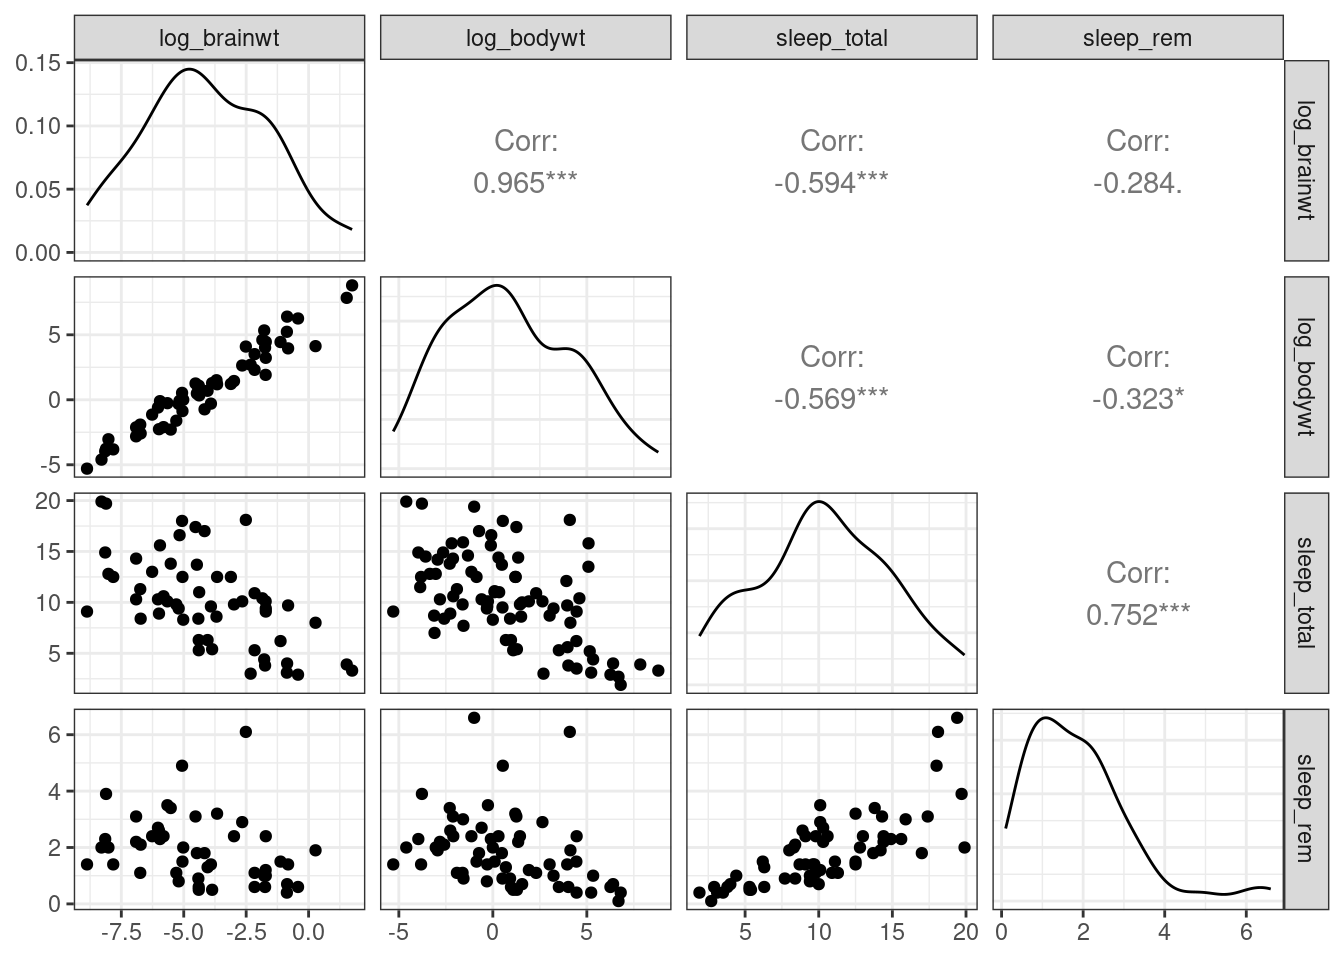
A scatterplot matrix is a collection of scatterplots organized as a grid. It is similar to a correlation plot but instead of displaying correlations, displays the underlying data.
You can create a scatterplot matrix using the
ggpairsfunction in theGGallypackage.We can illustrate its use by examining the relationships between mammal size and sleep characteristics. Brain weight and body weight are highly skewed (think mouse and elephant) so we’ll transform them to log brain weight and log body weight before creating the graph.
library(GGally)

data(msleep, package="ggplot2") # prepare data
library(dplyr)
df <- msleep %>%
  mutate(log_brainwt = log(brainwt),
         log_bodywt = log(bodywt)) %>%
  select(log_brainwt, log_bodywt, sleep_total, sleep_rem)

ggpairs(df) # create a scatterplot matrix