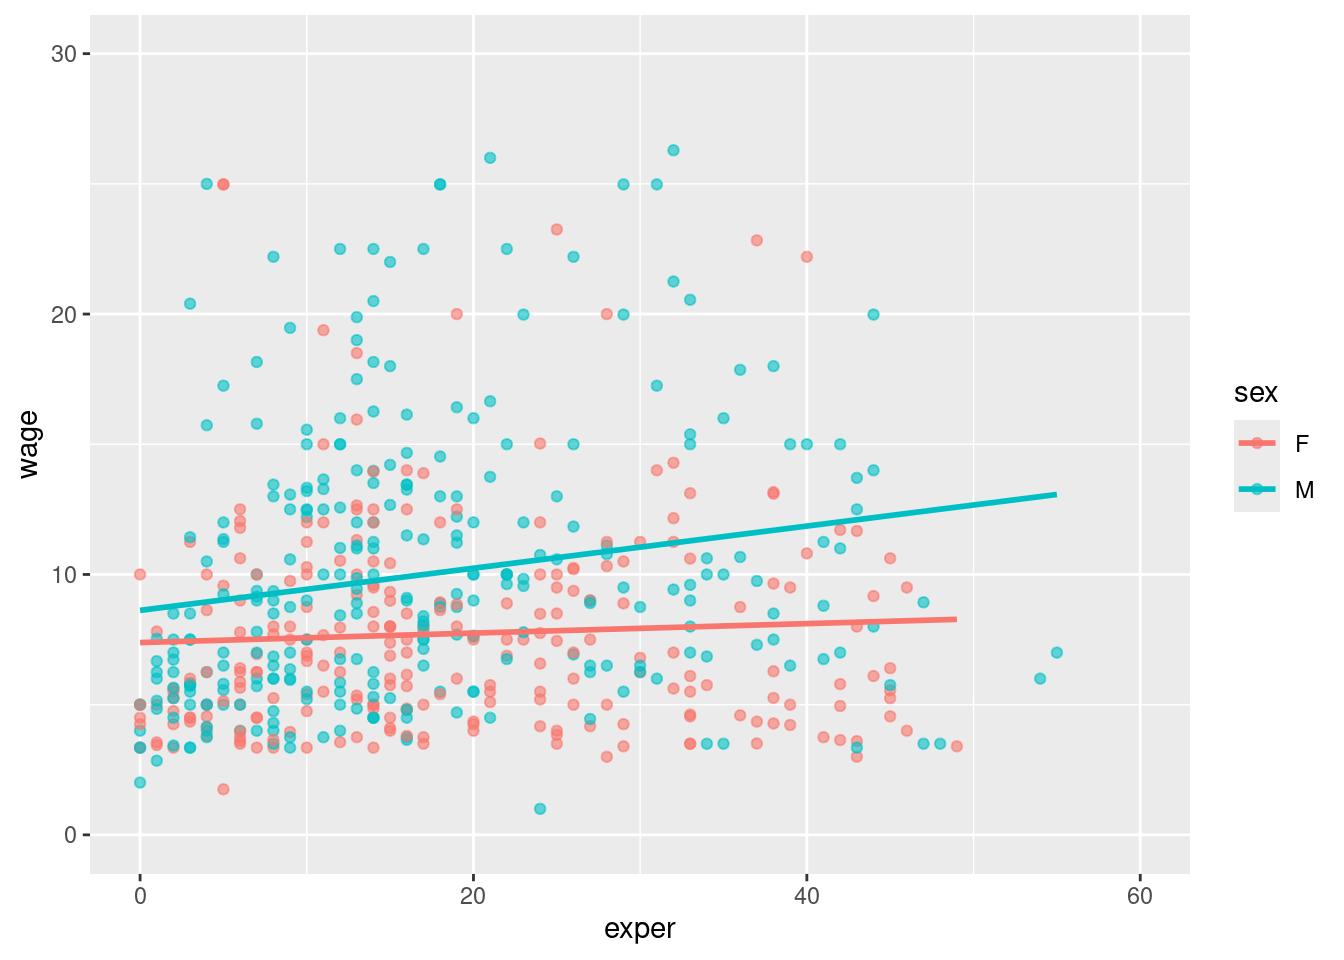
2.6 Coordinates Layer
The coordinate layer allows us to adjust the x and y coordinates

- We can adjust the min and max values, as well as the major ticks.
ggplot(data = plotdata,
       mapping = aes(x = exper,
                     y = wage,
                     color = sex)) +
  geom_point(alpha = .6) +
  geom_smooth(method = "lm",
              se = FALSE)+
  coord_cartesian(xlim = c(0,60),ylim = c(0,30))
## `geom_smooth()` using formula = 'y ~ x'