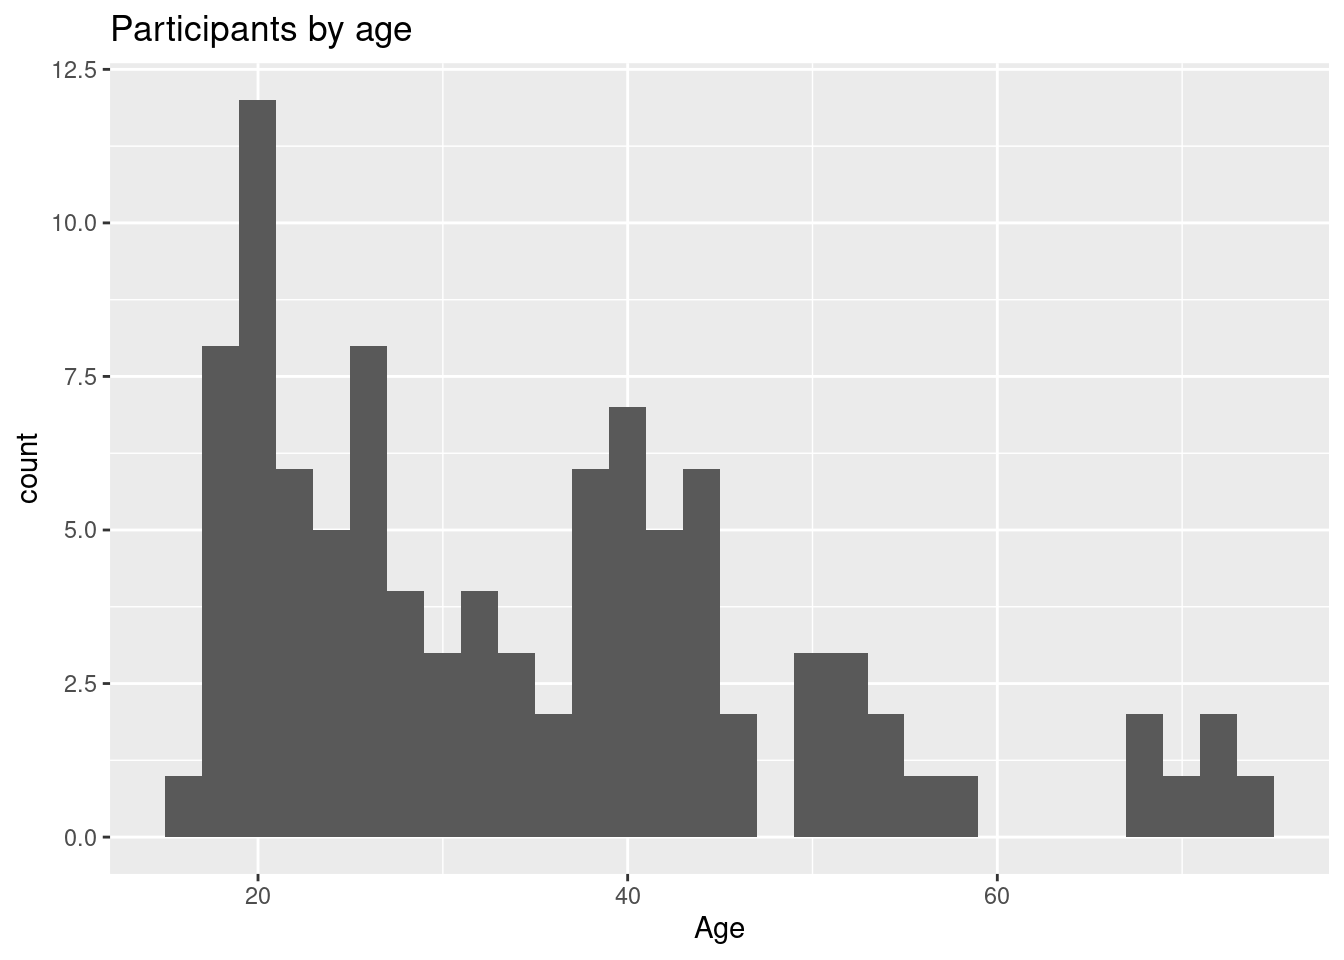
3.9 Histogram
A histogram is used to study the distribution of a single quantitative variable.
# plot the age distribution using a histogram
ggplot(Marriage, aes(x = age)) +
  geom_histogram() +
  labs(title = "Participants by age",
       x = "Age")