4.3 Grouped bar chart
Grouped bar charts place bars for the second categorical variable side-by-side.
- To create a grouped bar plot use the position = “dodge” option.
library(ggplot2)

# grouped bar plot
ggplot(mpg,
       aes(x = class,
           fill = drv)) +
  geom_bar(position = "dodge")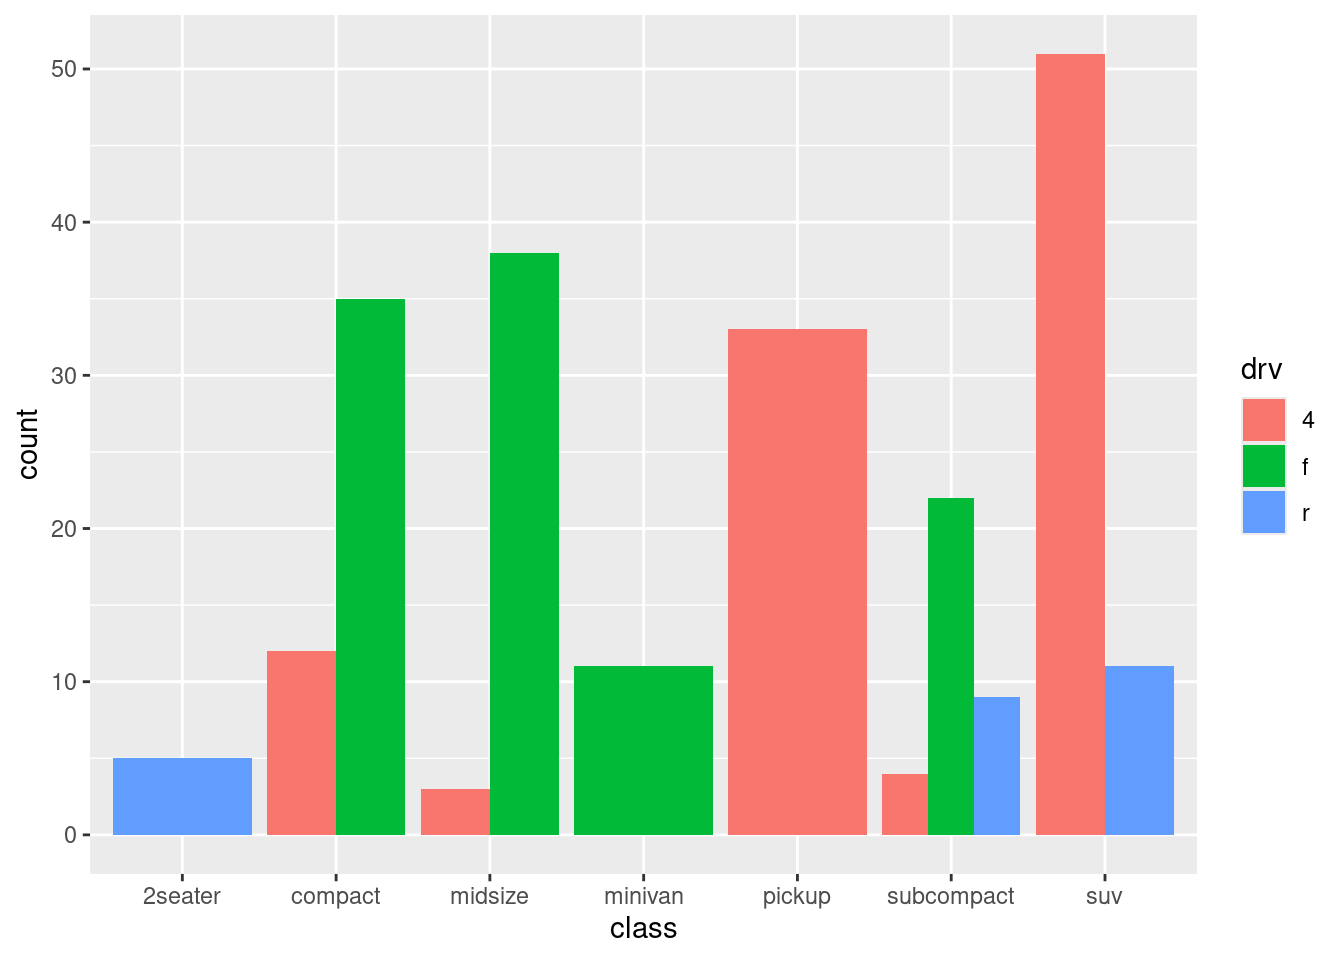
- Notice that all Minivans are front-wheel drive. By default, zero count bars are dropped and the remaining bars are made wider. This may not be the behavior you want. You can modify this using the position = position_dodge(preserve = “single”)” option.
library(ggplot2)

# grouped bar plot preserving zero count bars
ggplot(mpg,
    aes(x = class,
    fill = drv)) +
  geom_bar(position = position_dodge(preserve = "single"))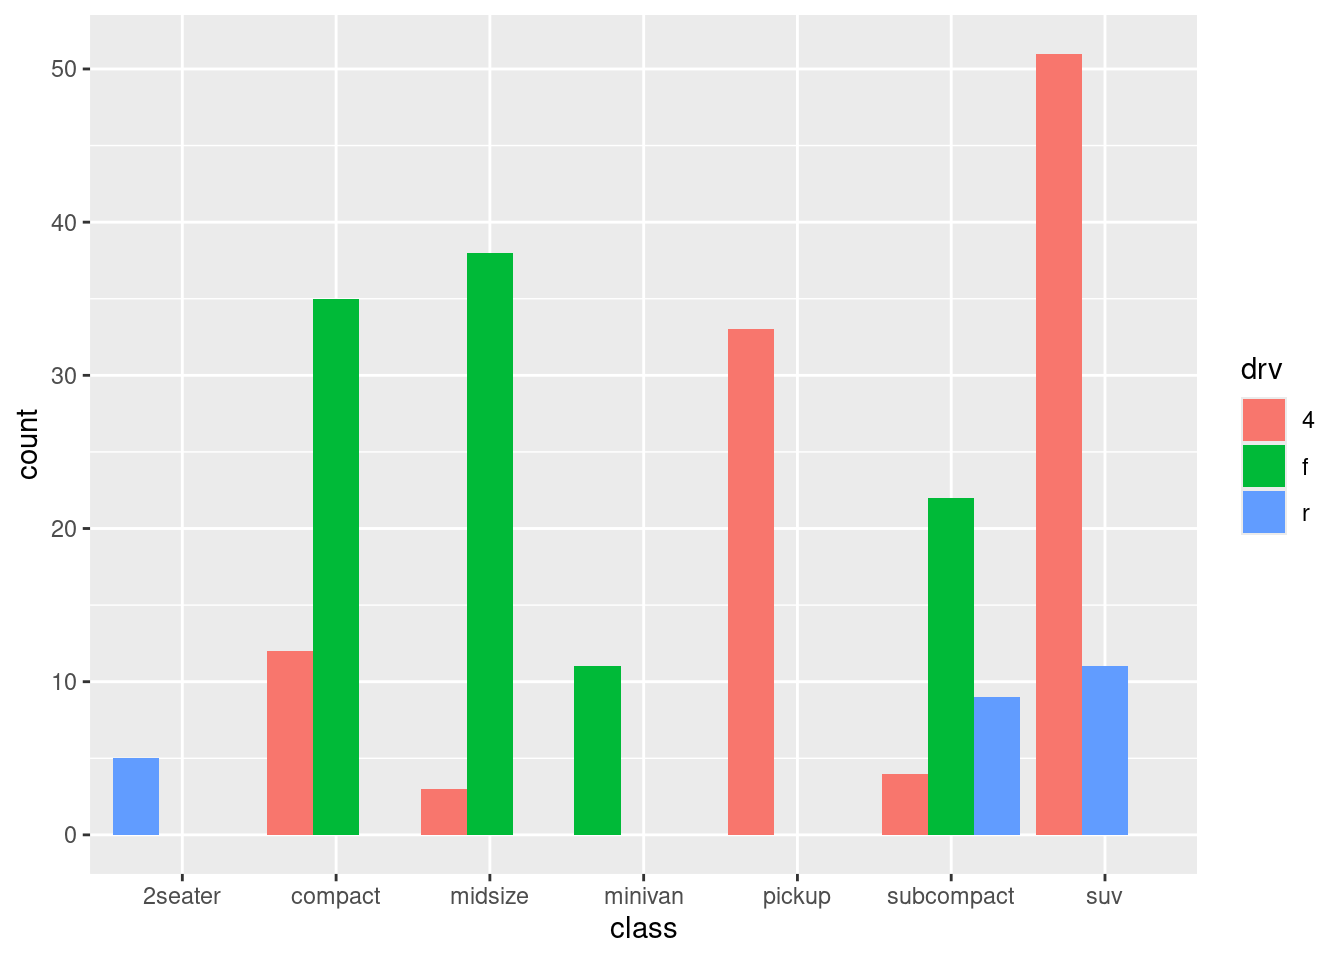
- Note that this option is only available in the latest development version of ggplot2, but should be generally available shortly.