pivot_wider()
pivot_longer()
ggcorrplot
visreg
ggsurvplot
vcd
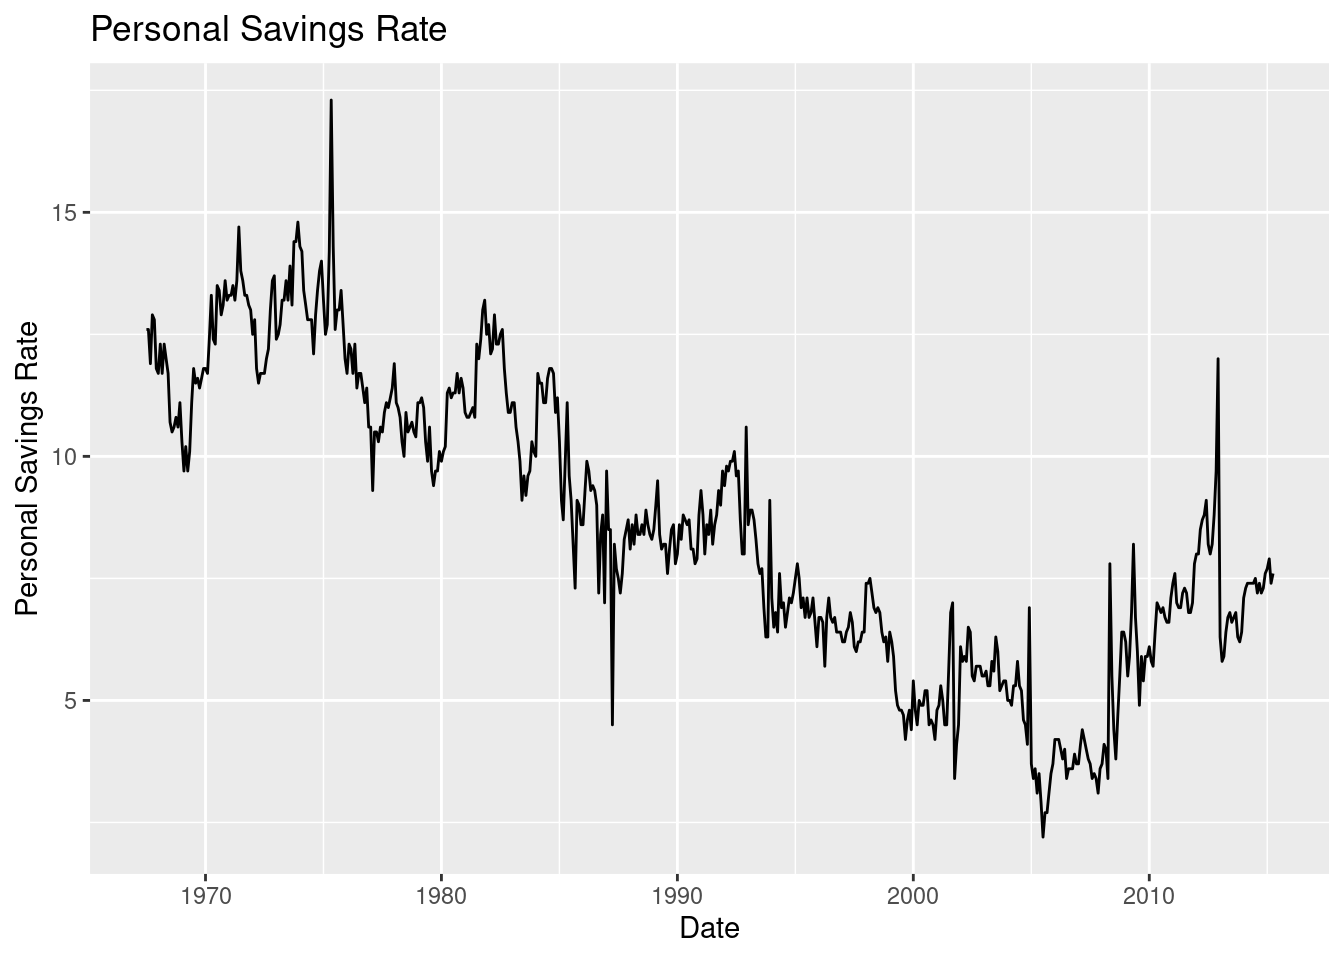
Let’s plot personal savings rate using simple line plot.
x = date
y = psavert
# load library
library(ggplot2)

ggplot(economics, aes(x = date, y = psavert)) +
  geom_line() +
  labs(title = "Personal Savings Rate",
       x = "Date",
       y = "Personal Savings Rate")