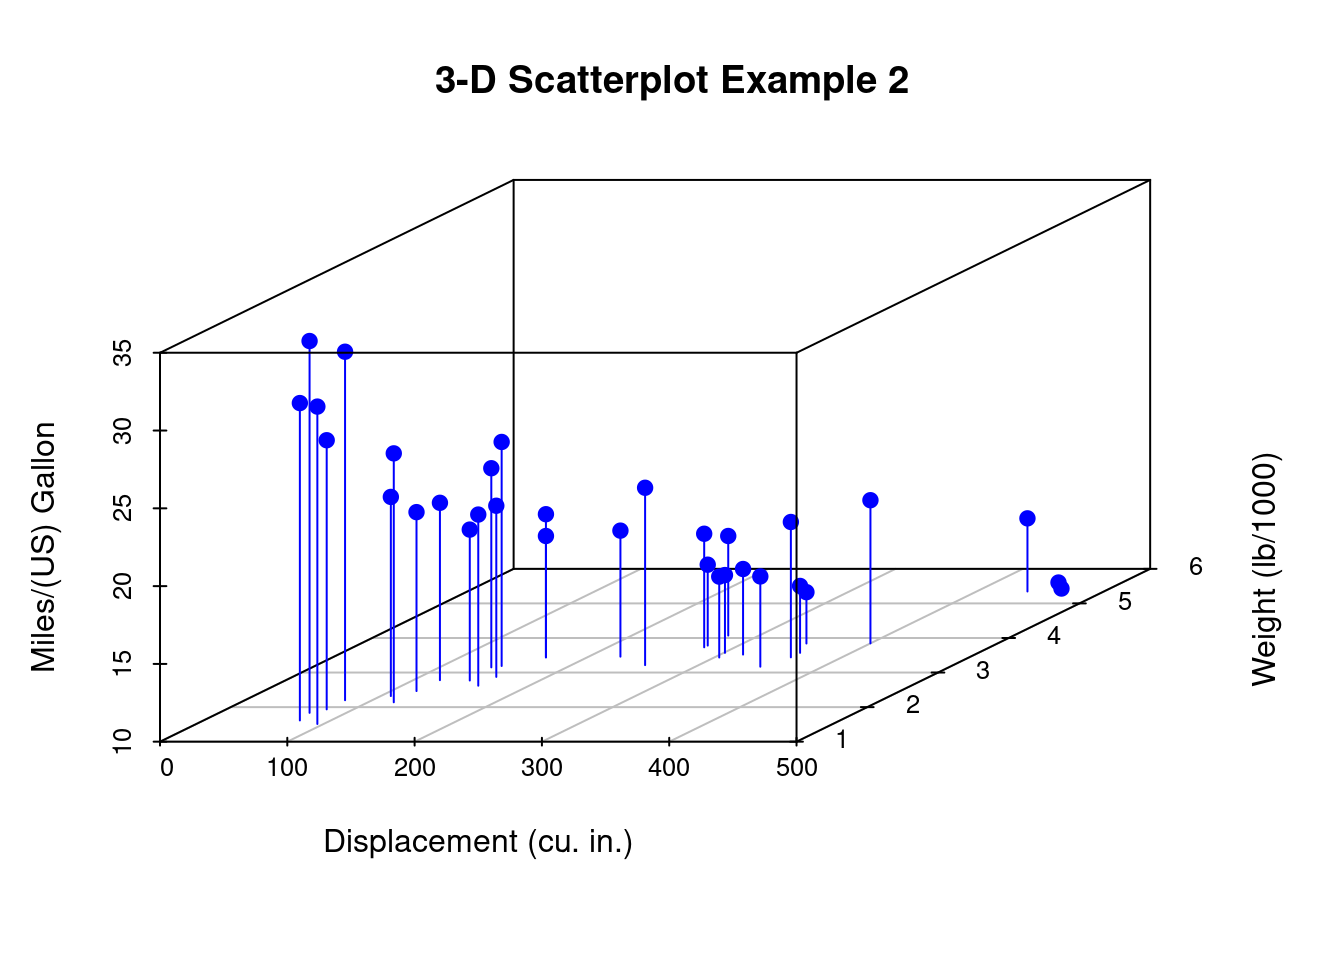
9.2 Modified 3-D Scatterplot
Here we modify the previous graph by
replacing the points with filled blue circles,
add drop lines to the x-y plane, and
create more meaningful labels.
library(scatterplot3d)
with(mtcars, {
  scatterplot3d(x = disp, y = wt, z = mpg,
                color = "blue", pch = 19, # solid blue circles
                type = "h", # lines to the horizontal plane
                main = "3-D Scatterplot Example 2",
                xlab = "Displacement (cu. in.)",
                ylab = "Weight (lb/1000)",
                zlab = "Miles/(US) Gallon")
})