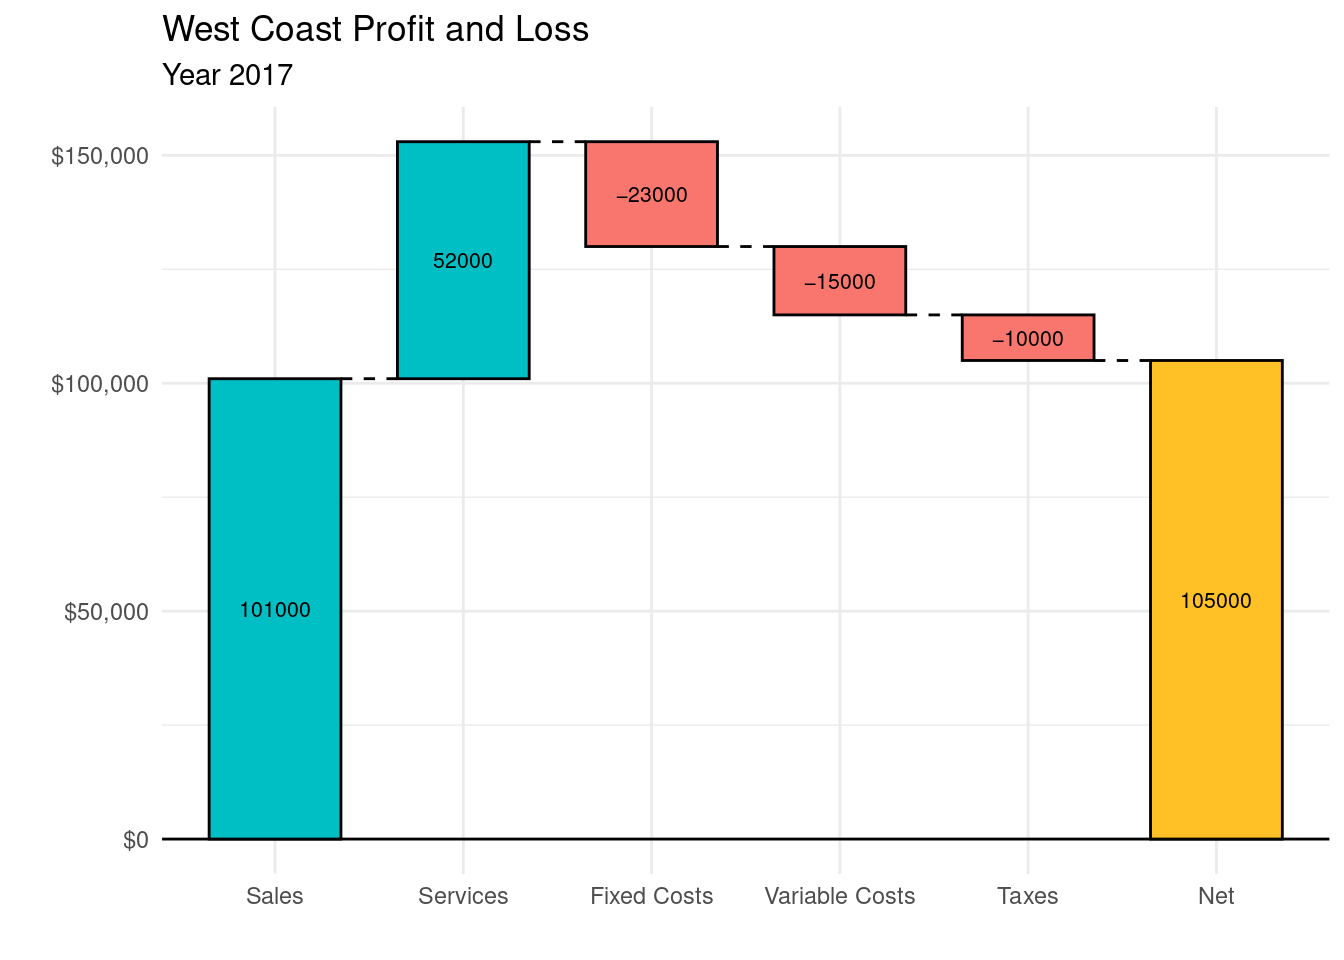
9.22 Modified Waterfall Chart
Since the
waterfallfunction creates aggplot2graph, we can use additional functions to customize the results.Below, we add a total (net) column.
# create waterfall chart with total column
waterfall(income,
          calc_total=TRUE,
          total_axis_text = "Net",
          total_rect_text_color="black",
          total_rect_color="goldenrod1") +
  scale_y_continuous(label=scales::dollar) +
  labs(title = "West Coast Profit and Loss",
       subtitle = "Year 2017", y="", x="") +
theme_minimal() 