6.5 Data by US County
# enter violent crime rates by county
crimes_ct <- data.frame(
  county = c("fairfield", "hartford",
             "litchfield", "middlesex",
             "new haven", "new london",
             "tolland", "windham"),
  value = c(3.00, 3.32,
            1.02, 1.24,
            4.13, 4.61,
            0.16, 1.60)
)


crimes_ct
## county value
## 1 fairfield 3.00
## 2 hartford 3.32
## 3 litchfield 1.02
## 4 middlesex 1.24
## 5 new haven 4.13
## 6 new london 4.61
## 7 tolland 0.16
## 8 windham 1.60# obtain region codes for connecticut
data(county.regions,
package = "choroplethrMaps")
region <- county.regions %>%
filter(state.name == "connecticut")
region## region county.fips.character county.name state.name state.fips.character
## 1 9001 09001 fairfield connecticut 09
## 2 9003 09003 hartford connecticut 09
## 3 9005 09005 litchfield connecticut 09
## 4 9007 09007 middlesex connecticut 09
## 5 9009 09009 new haven connecticut 09
## 6 9011 09011 new london connecticut 09
## 7 9013 09013 tolland connecticut 09
## 8 9015 09015 windham connecticut 09
## state.abb
## 1 CT
## 2 CT
## 3 CT
## 4 CT
## 5 CT
## 6 CT
## 7 CT
## 8 CT# join crime data to region code data
plotdata <- inner_join(crimes_ct,
region,
by=c("county" = "county.name"))
plotdata## county value region county.fips.character state.name
## 1 fairfield 3.00 9001 09001 connecticut
## 2 hartford 3.32 9003 09003 connecticut
## 3 litchfield 1.02 9005 09005 connecticut
## 4 middlesex 1.24 9007 09007 connecticut
## 5 new haven 4.13 9009 09009 connecticut
## 6 new london 4.61 9011 09011 connecticut
## 7 tolland 0.16 9013 09013 connecticut
## 8 windham 1.60 9015 09015 connecticut
## state.fips.character state.abb
## 1 09 CT
## 2 09 CT
## 3 09 CT
## 4 09 CT
## 5 09 CT
## 6 09 CT
## 7 09 CT
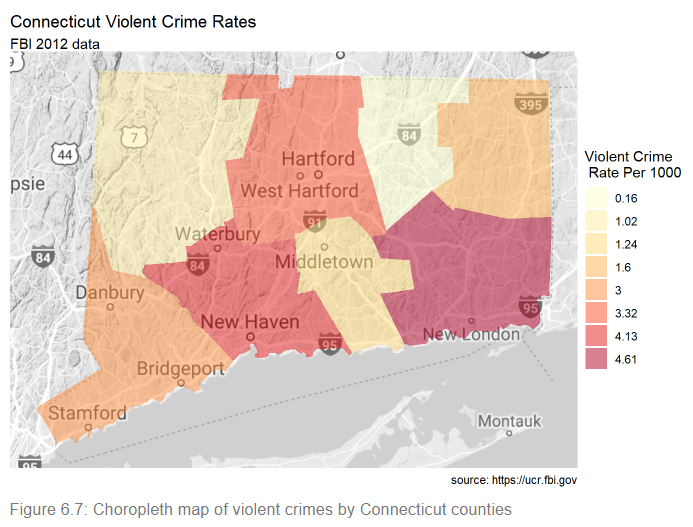
## 8 09 CT# create choropleth map
county_choropleth(plotdata,
state_zoom = "connecticut",
reference_map = TRUE,
num_colors = 8) +
scale_fill_brewer(palette="YlOrRd") +
labs(title = "Connecticut Violent Crime Rates",
subtitle = "FBI 2012 data",
caption = "source: https://ucr.fbi.gov",
fill = "Violent Crime\n Rate Per 1000")
See the choroplethr help for more details.
The tmap package provides another way of creating choropleth maps in R