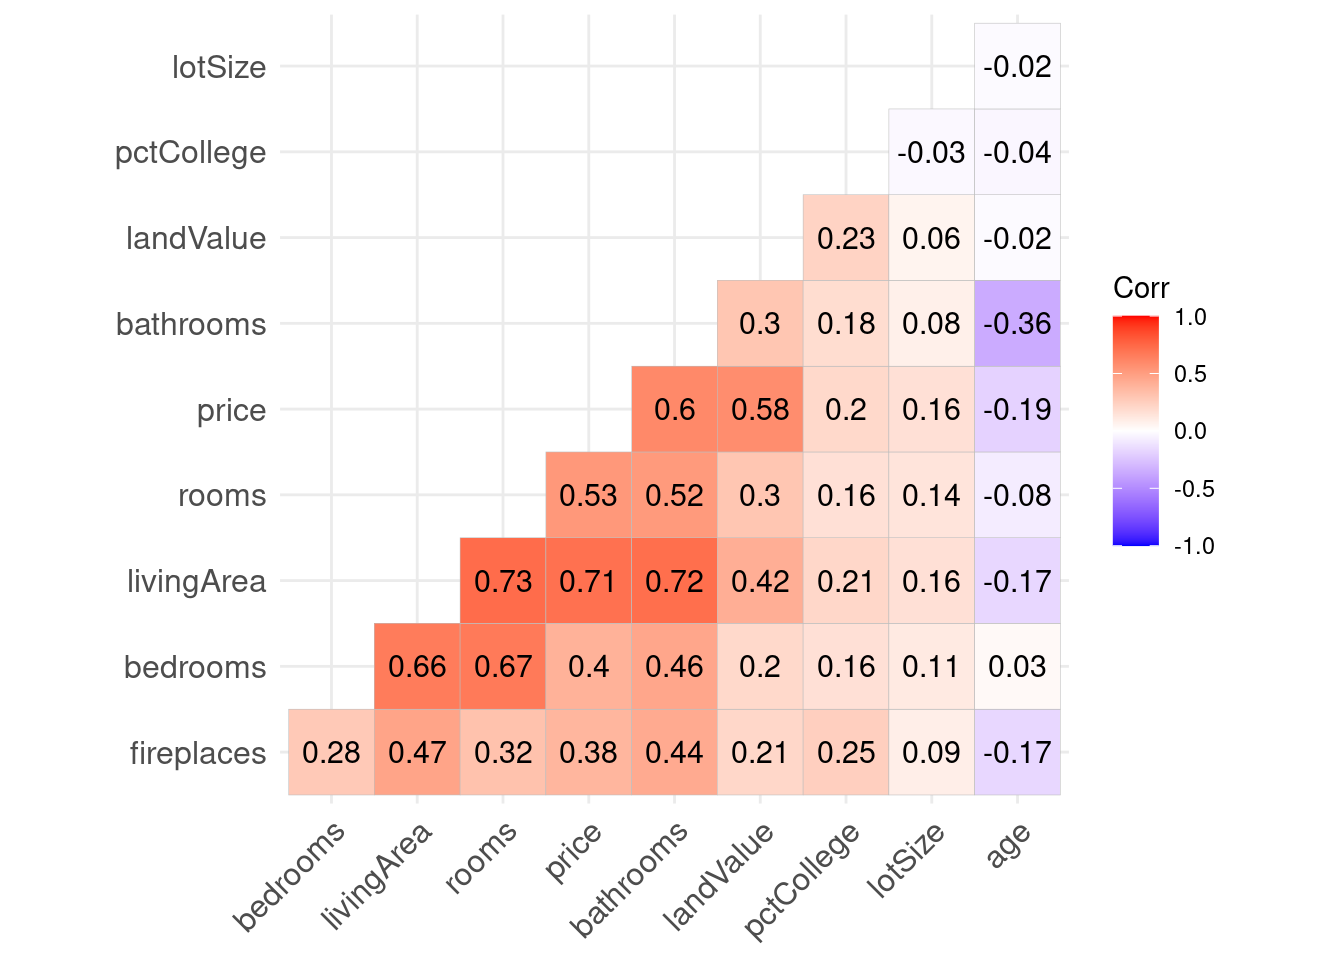
8.4 ggcorrplot function
The ggcorrplot function has a number of options for customizing the output. For example,
hc.order = TRUEreorders the variables, placing variables with similar correlation patterns together.type = "lower"plots the lower portion of the correlation matrix.lab = TRUEoverlays the correlation coefficients (as text) on the plot.