pivot_wider()
pivot_longer()
ggcorrplot
visreg
ggsurvplot
vcd
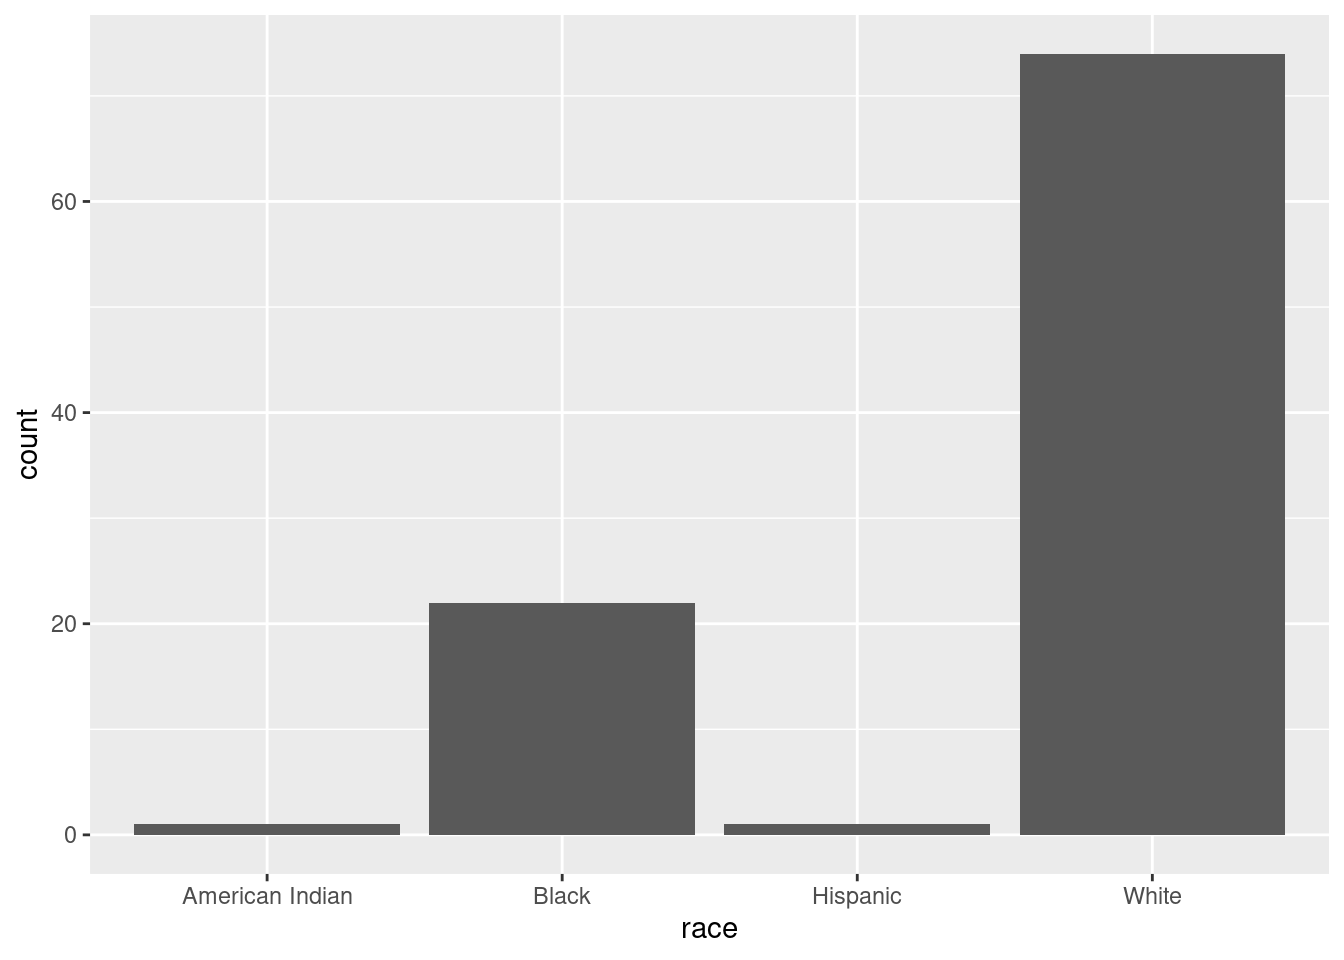
A bar chart is used to display the relationship between a numeric and a categorical variable.
# plot the distribution of race
ggplot(Marriage, aes(x = race)) +
  geom_bar()