2.8 scales
Scales control how variables are mapped to the visual characteristics of the plot.
Scale functions (which start with scale_) allow us to modify this mapping.
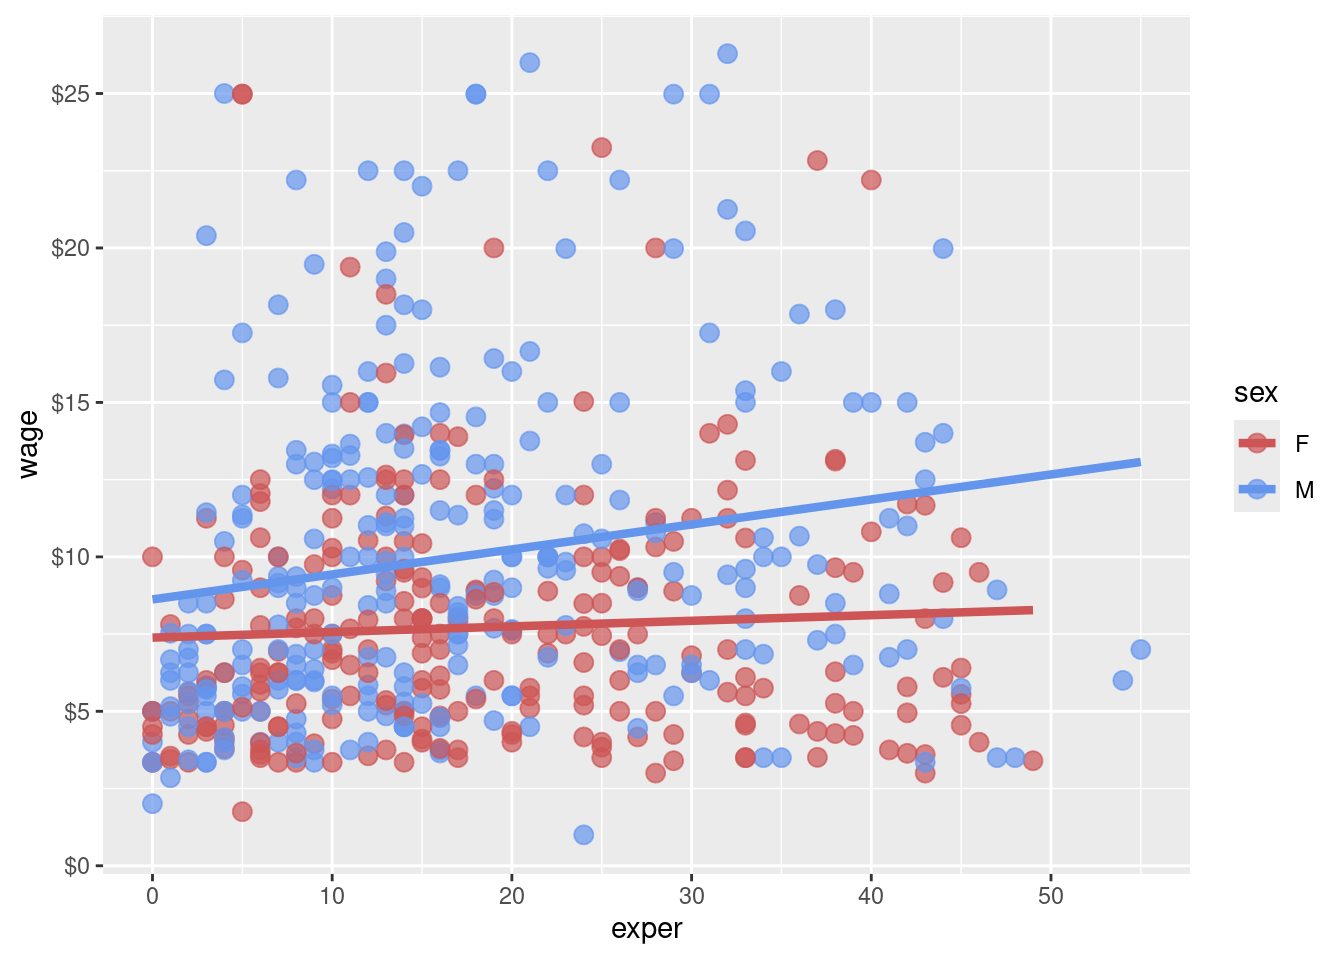
# modify the x and y axes and specify the colors to be used
ggplot(data = plotdata,
       mapping = aes(x = exper,
                     y = wage,
                     color = sex)) +
  geom_point(alpha = .7,
             size = 3) +
  geom_smooth(method = "lm",
              se = FALSE,
              size = 1.5) +
  scale_x_continuous(breaks = seq(0, 60, 10)) +
  scale_y_continuous(breaks = seq(0, 30, 5),
                     label = scales::dollar) +
  scale_color_manual(values = c("indianred3",
                                "cornflowerblue"))