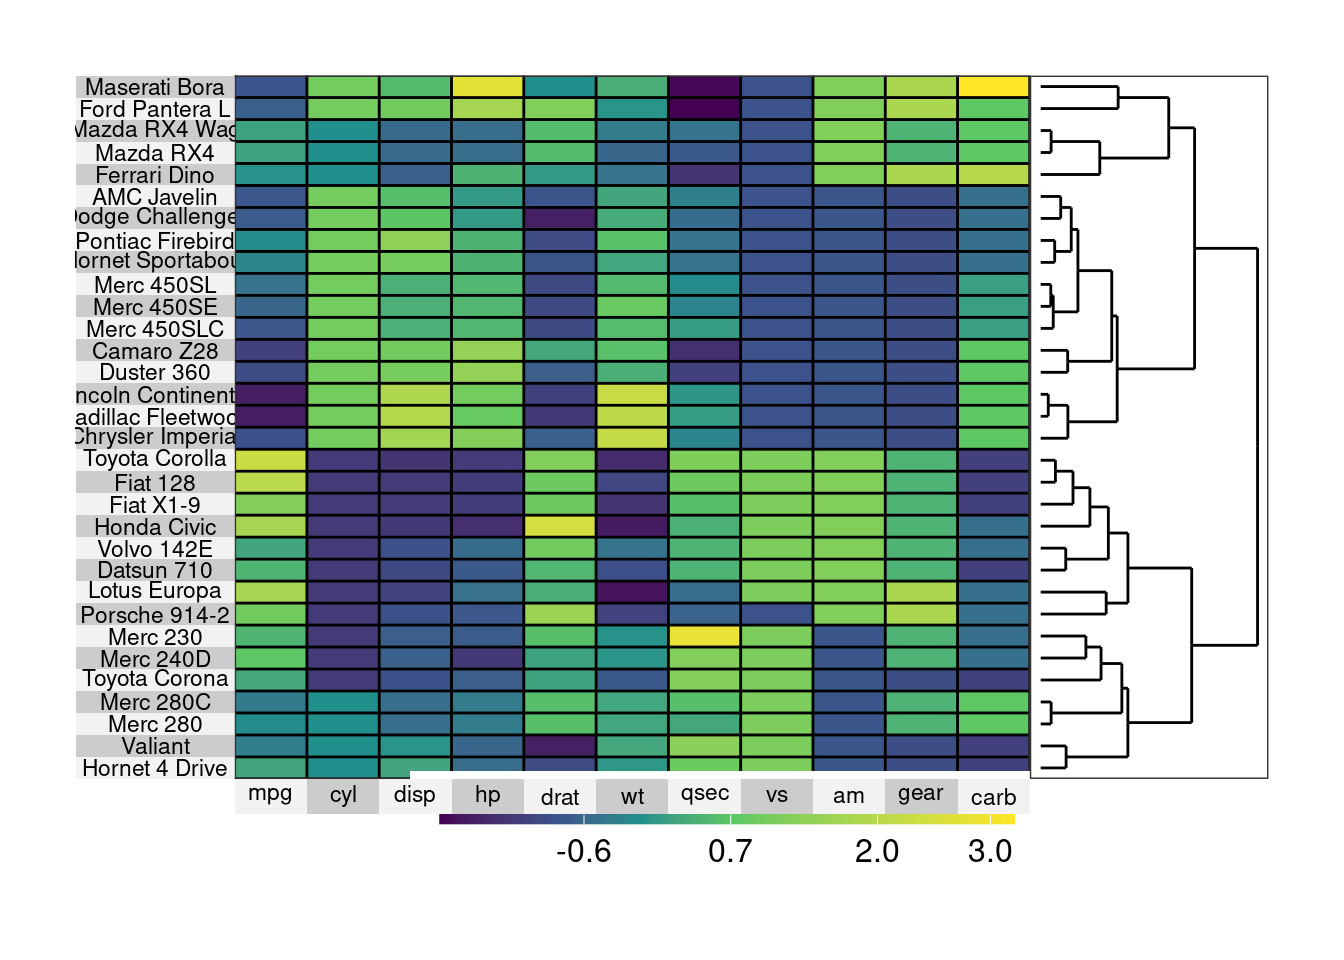
9.15 Sorted Heatmap
We can use clustering to sort the rows and/or columns.
In the example below, we’ll (1) sort the rows so that cars that are similar appear near each other, and (2) adjust the text and label sizes.
# sorted heat map
superheat(mtcars,
          scale = TRUE,
          left.label.text.size=3,
          bottom.label.text.size=3,
          bottom.label.size = .05,
          row.dendrogram = TRUE )