What does this show ?
ggplot(data=michelle_posterior,aes(x=pi))+
  geom_density()
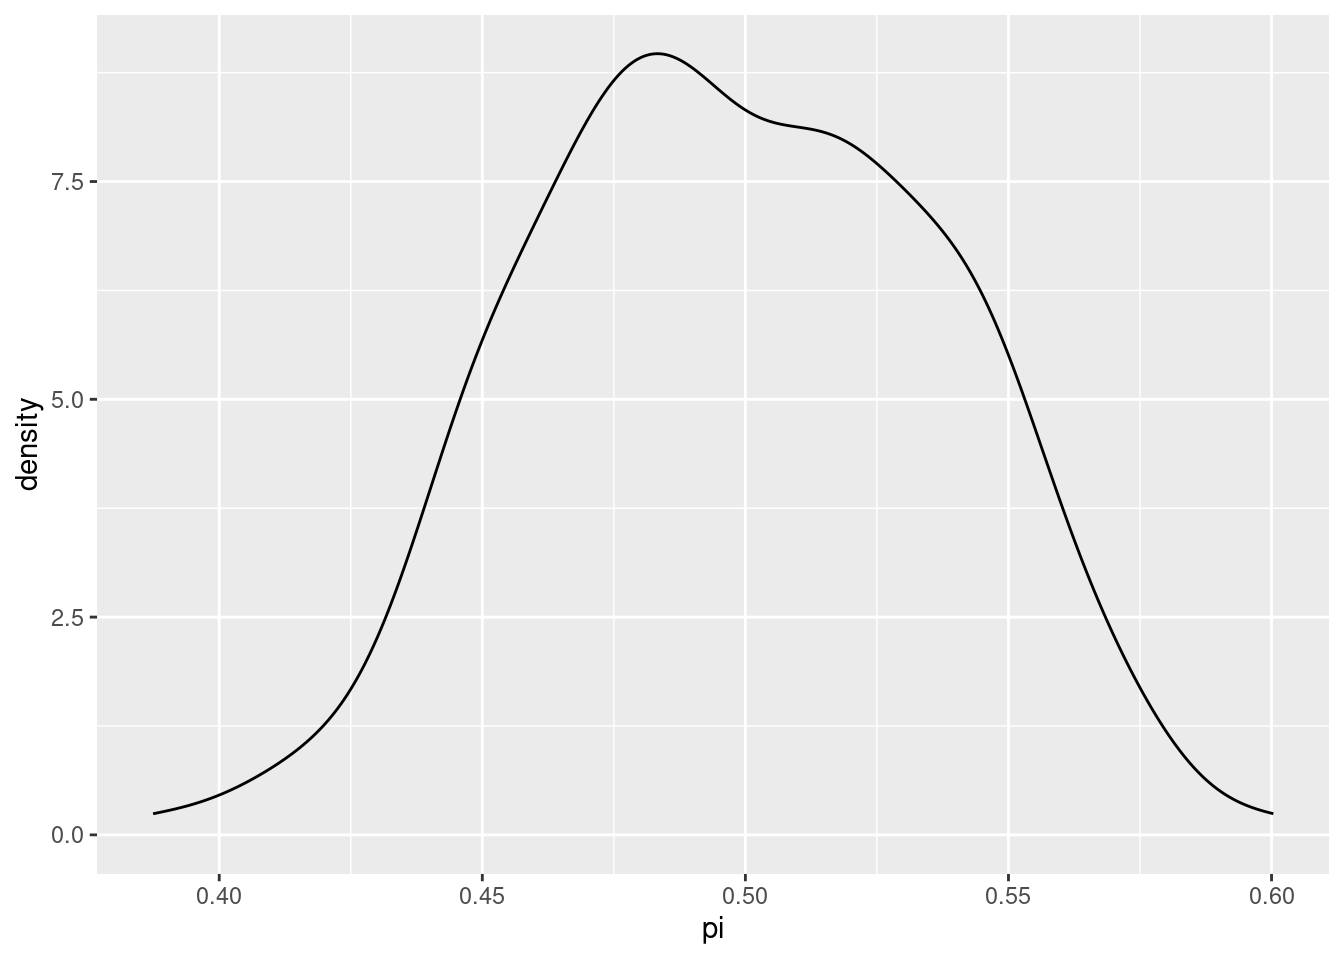
michelle_posterior |>
  summarise(mean(pi),sd(pi))
##    mean(pi)     sd(pi)
## 1 0.4983387 0.03881996
# We can also check the number of data points it is based on

nrow(michelle_posterior)
## [1] 198