19.7 Airbnb posterior group-level analysis
- This section looks at neighborhood-level trends, focusing on two neighborhoods with mean log price but vastly different walk ability
## # A tibble: 2 × 4
##   neighborhood walk_score mean_log_price n_listings
##   <fct>             <int>          <dbl>      <int>
## 1 Edgewater            89           4.47         35
## 2 Pullman 49 4.47 5- Compare the group-level intercepts for models with (closed circle) and without (open circle) the
walk_scoregroup level indicator:
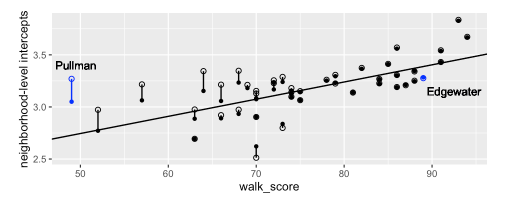
The model with the
walk_scorepredictor has pulled Pullman’s intercept (\(\gamma_0 + \gamma_1 U_j\)) down, closer to the trendNote the small sample size for Pullman. Using group level predictors helps us to pool information across groups, improving understanding of small sample size groups.