19.4 Air-bnb Group Level predictors
The data also contains group level predictors: walk_score and transit score
These are the same for each property in a given neighborhood.
airbnb %>%
  select(price, neighborhood, walk_score, transit_score) %>%
  head(3)
## price neighborhood walk_score transit_score
## 1 85 Albany Park 87 62
## 2 35 Albany Park 87 62
## 3 175 Albany Park 87 62- We can use
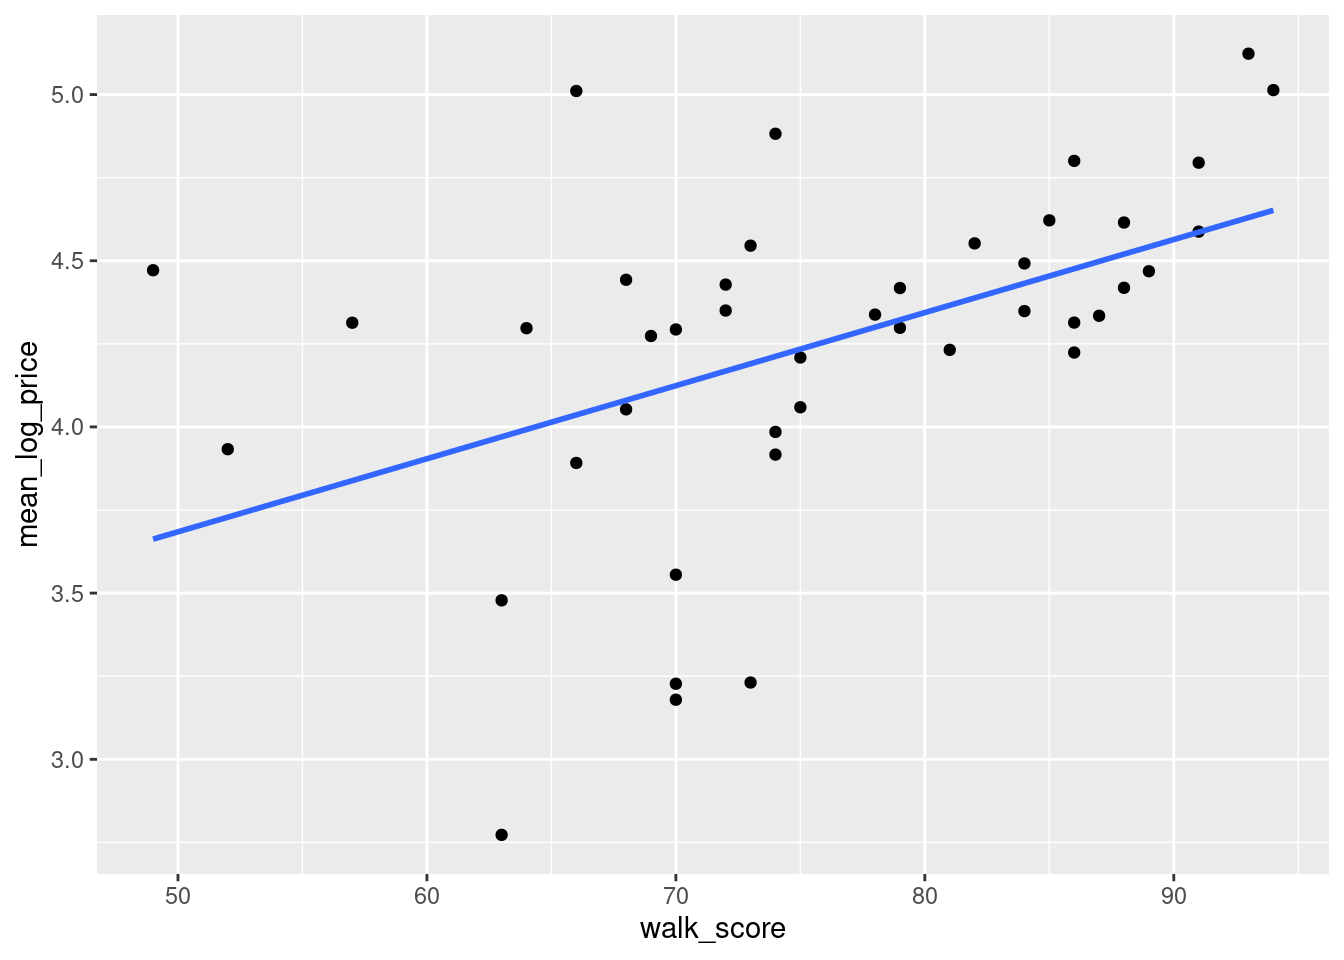
walk_scoreto ‘explain’ some of the variation from neighborhood to neighborhood.
nbhd_features <- airbnb %>%
  group_by(neighborhood, walk_score) %>%
  summarize(mean_log_price = mean(log(price)), n_listings = n(),.groups="drop")


ggplot(nbhd_features, aes(y = mean_log_price, x = walk_score)) +
  geom_point() +
  geom_smooth(method = "lm", se = FALSE)
## `geom_smooth()` using formula = 'y ~ x'