12.9 Data Set 2
In 2017, Cards Against Humanity Saves America launched a series of monthly surveys in order to get the “Pulse of the Nation”
- \(Y\): number of books somebody has read in the past year
- \(X_{1}\): age
- \(X_{2}\): whether they’d rather be wise but unhappy or happy but unwise
\[X_{2} = \begin{cases} 1 & \text{wise but unhappy} \\ 0 & \text{happy but unwise}\end{cases}\]
# Load data
data(pulse_of_the_nation)
pulse <- pulse_of_the_nation %>%
  filter(books < 100) # avoid outliers
p1 <- ggplot(pulse, aes(x = books)) +
geom_histogram(color = "white")
p2 <- ggplot(pulse, aes(y = books, x = age)) +
geom_point()
p3 <- ggplot(pulse, aes(y = books, x = wise_unwise)) +
geom_boxplot()
# patchwork
p1 + p2 + p3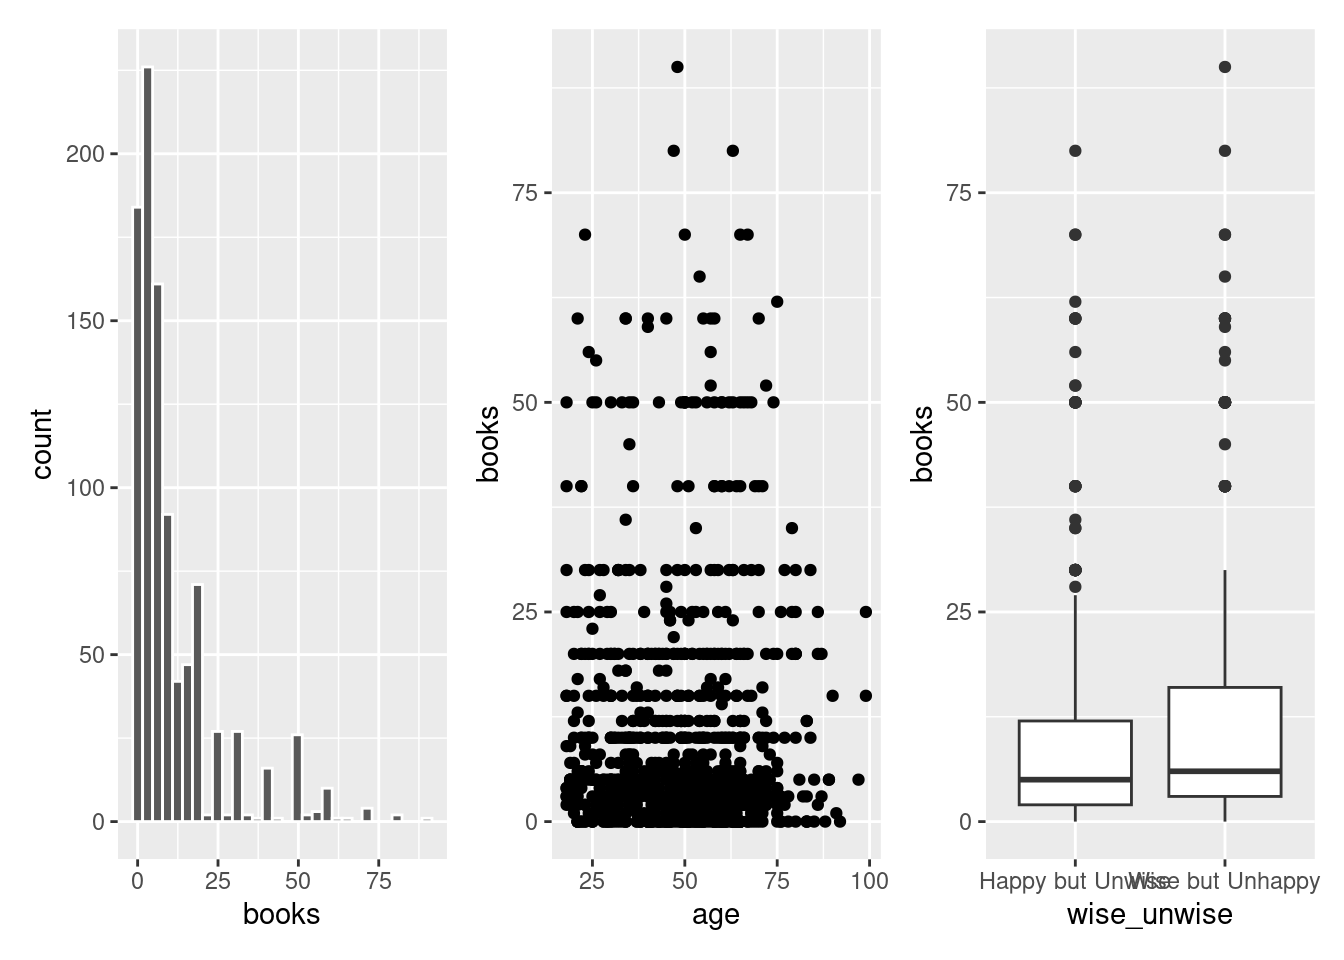
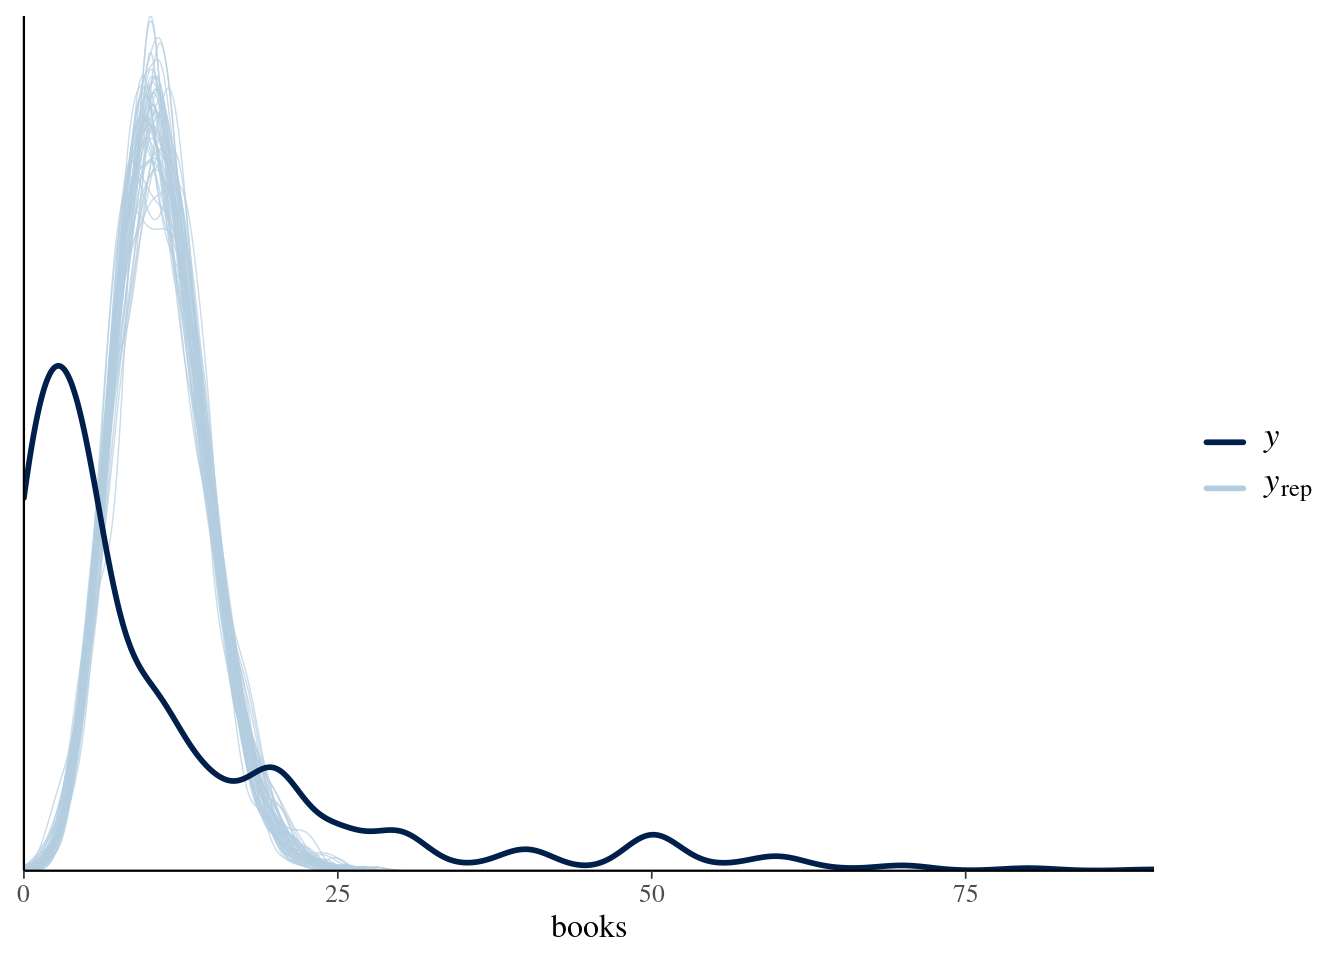
12.9.1 Poisson Regression
Should we model books with Poisson regression?
books_poisson_sim <- stan_glm(
  books ~ age + wise_unwise,
  data = pulse, family = poisson,
  prior_intercept = normal(0, 2.5, autoscale = TRUE),
  prior = normal(0, 2.5, autoscale = TRUE),
  prior_aux = exponential(1, autoscale = TRUE),
  chains = 4, iter = 5000*2, seed = 84735)