12.8 Posterior Prediction
Consider the state of Minnesota, a historically Democrat state with 73.3% of residents residing in urban areas and 4 anti-discrimination laws.
equality %>%
  filter(state == "minnesota")
## # A tibble: 1 × 6
## state region gop_2016 laws historical percent_urban
## <fct> <fct> <dbl> <dbl> <fct> <dbl>
## 1 minnesota midwest 44.9 4 dem 73.3# Calculate posterior predictions
set.seed(84735)
mn_prediction <- posterior_predict(
equality_model, newdata = data.frame(percent_urban = 73.3,
historical = "dem"))mcmc_hist(mn_prediction, binwidth = 1) +
geom_vline(color = "purple", xintercept = 4, linewidth = 4) +
xlab("Predicted number of laws in Minnesota")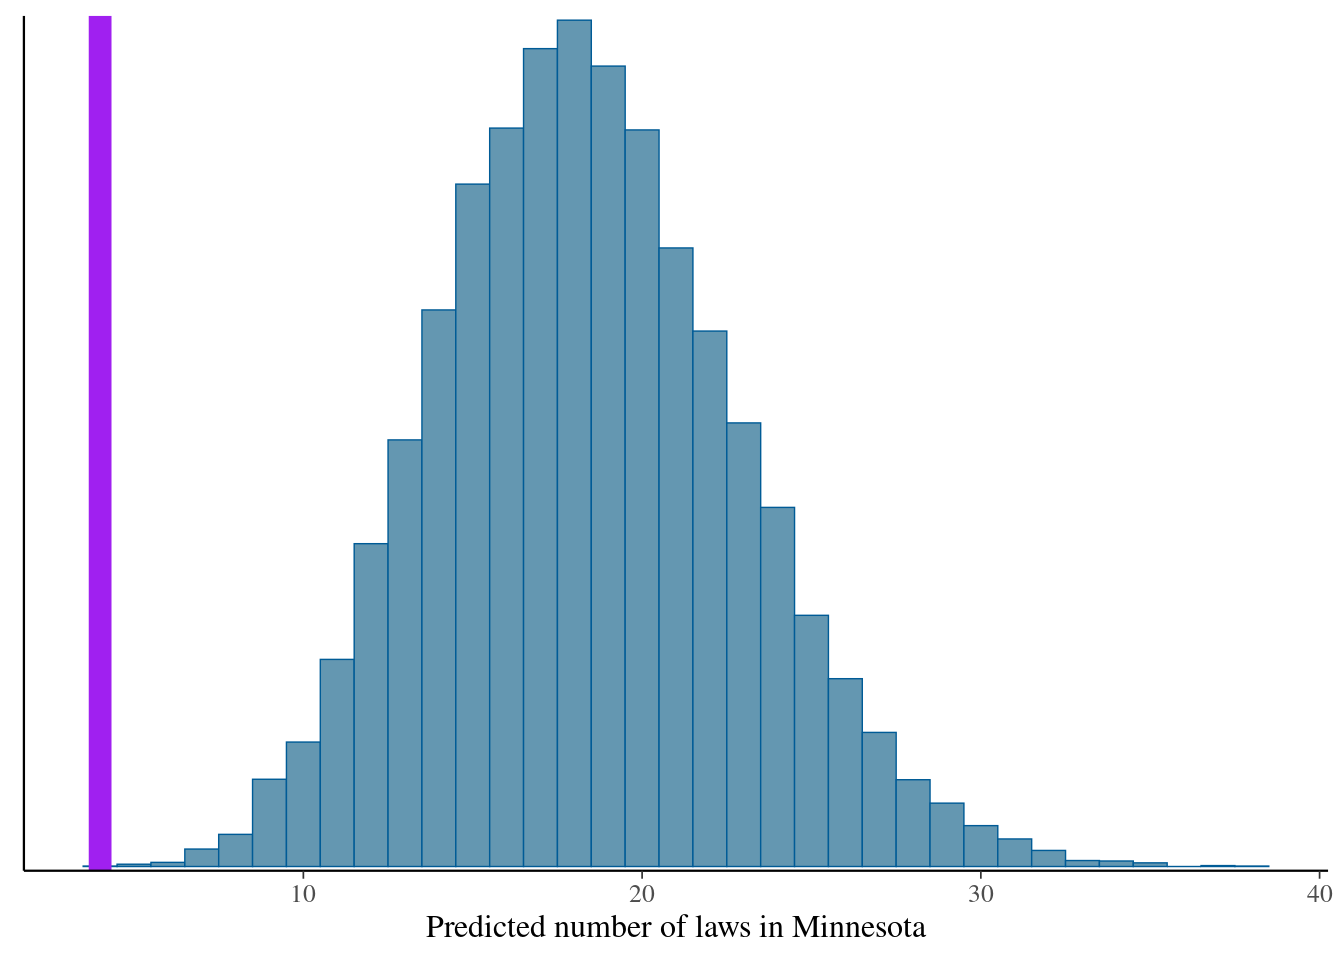
The posterior distribution leads to a credible interval with values near (10, 30) for the number of anti-discriminatory laws, but Minnesota has 4 such laws.