Bayes Rules! Book Club
Welcome
Book club meetings
Pace
Preface
0.1
Bayesian statistics?
0.2
Tips and tricks from the authors
0.3
Set up
0.4
The authors:
1
The Big (Bayesian) Picture
1.1
Thinking like a Bayesian 1/4
1.2
Quiz time!
1.3
Thinking like a Bayesian 2/4
1.3.1
Interpreting probability:
1.4
Thinking like a Bayesian 3/4
1.4.1
Bayesian balancing act
1.5
Thinking like a Bayesian 4/4
1.5.1
Asking question
1.6
Quick history lesson
1.7
Look ahead
1.7.1
4 units
1.8
Summary
1.9
Resources mentioned
1.9.1
Other Bayesian books:
1.9.2
Drawing DAG (Directed Acyclic Graph)
1.9.3
Podcast
1.10
Meeting Videos
1.10.1
Cohort 1
1.10.2
Cohort 2
1.10.3
Cohort 3
1.10.4
Cohort 4
2
Bayes’ Rule
2.1
Building a Bayesian model for events
2.1.1
Workflow:
2.2
Prior probability model
2.3
Model for interpreting the data
2.4
Posterior probability model
2.5
Posterior simulation
2.6
Example Pop vs Soda vs Coke
2.7
Building a Bayesian model for random variables
2.7.1
Prior probability model
2.7.2
Data model
2.7.3
Posterior probability model
2.7.4
Posterior simulation
2.8
Links shared in the second meeting
2.9
Meeting Videos
2.9.1
Cohort 1
2.9.2
Cohort 2
2.9.3
Cohort 3
2.9.4
Cohort 4
3
The Beta-Binomial Bayesian Model
3.1
What is a Beta Binomial model for ?
3.2
The Beta Prior Model
3.3
Are we good so far ?
3.4
How has the model changed from last week ?
3.5
What quality does the probability density function have ?
3.6
Tuning the Beta Prior
3.7
The Binomial Data Model and Likelihood
3.8
Beta Posterior Model
3.9
Plot of the Beta Posterior Model
3.10
Effects of New Data ?
3.11
Simulating the Beta-Binomial
3.12
What does this show ?
3.13
Milgram’s behavior study of obedience
3.14
What do you think the prior beliefs were ?
3.15
Let plot them to find out
3.16
So what actually happened ?
3.17
What conclusions can we draw ?
3.18
Let’s plot the prior, likelihood and posterior
3.19
Summary
3.20
Meeting Videos
3.20.1
Cohort 1
3.20.2
Cohort 2
3.20.3
Cohort 3
3.20.4
Cohort 4
4
Balance and Sequentiality in Bayesian Analyses
4.1
Introductory Example
4.2
Different priors, different posteriors
4.3
Different data, different posteriors
4.4
Striking a balance between the prior and data
4.4.1
Connecting concepts to theory
4.5
Sequential analysis: evolving with data
4.6
Meeting Videos
4.6.1
Cohort 1
4.6.2
Cohort 2
4.6.3
Cohort 3
4.6.4
Cohort 4
5
Conjugate Families
5.1
Greek letters
5.2
Revisiting choice of prior
5.2.1
Reminder
the Beta-Binomial Model:
5.3
Joy!
5.4
Gamma-Poisson conjugate family 1/8
5.4.1
Prior:
5.5
Gamma-Poisson conjugate family 2/8
5.5.1
Poisson
data
model:
5.6
Gamma-Poisson conjugate family 3/8
5.6.1
Poisson pmfs with different
\(\tau\)
5.7
Gamma-Poisson conjugate family 4/8
5.7.1
Joint probability mass function
5.8
Gamma-Poisson conjugate family 5/8
5.8.1
Potential priors?
5.9
Gamma-Poisson conjugate family 6/8
5.9.1
Gamma prior : Gamma and Exponential models
5.10
Gamma-Poisson conjugate family 6/n
5.10.1
Quiz!
5.11
Gamma-Poisson conjugate family 7/8
5.11.1
Applications!
5.12
Gamma-Poisson conjugate family 8/8
5.12.1
Gamma-Poisson conjugacy
5.13
Normal-Normal conjugate family
5.14
Normal Model
5.14.1
Prior X Likelihood = Posterior
5.15
Why no simulation in this chapter?
5.16
Critiques of conjugate family
5.17
Summary
5.18
Meeting Videos
5.18.1
Cohort 1
5.18.2
Cohort 2
5.18.3
Cohort 3
5.18.4
Cohort 4
6
Approximating the Posterior
6.1
Motivation for approximations
6.2
Coming into View
6.3
Grid Approximaiton
6.4
Beta Binomial Example
6.5
MCMC
6.6
Beta-Binomial MCMC
6.7
Gamma-Poisson MCMC
6.8
Markov chain diagnostics
6.9
Danger Zone
6.10
Summary
6.11
Meeting Videos
6.11.1
Cohort 1
6.11.2
Cohort 2
6.11.3
Cohort 3
6.11.4
Cohort 4
7
MCMC under the Hood
7.1
The big idea 1/2
7.2
The big idea 2/2
7.3
The Metropolis-Hastings algorithm
7.4
Implementing the Metropolis-Hastings
7.4.1
Quiz!
7.5
A Beta-Binomial example
7.6
Why the algorithm works
7.7
Chapter summary
7.8
Meeting Videos
7.8.1
Cohort 1
7.8.2
Cohort 2
7.8.3
Cohort 3
7.8.4
Cohort 4
8
Posterior Inference & Prediction
8.1
Introduction
8.2
Posterior estimation
8.3
Posterior hypothesis testing
8.4
Posterior prediction
8.5
Posterior analysis with MCMC
8.5.1
Posterior simulation
8.5.2
Posterior estimation & hypothesis testing
8.5.3
Posterior prediction
8.6
Bayesian benefits
8.7
Meeting Videos
8.7.1
Cohort 1
8.7.2
Cohort 2
8.7.3
Cohort 3
8.7.4
Cohort 4
9
Simple Normal Regression
9.1
Begining of Unit 3!
9.2
New terms
9.3
Building the regression model
9.3.1
Data model
9.3.2
Normal regression assumptions
9.3.3
Specifying the priors
9.3.4
Putting it all together
9.4
Tuning prior models for regression parameters
9.5
Posterior simulatiion
9.5.1
Simulation via rstanarm
9.5.2
Simulation directly with rstan
9.6
Interpreting the posterior
9.7
Posterior prediction
9.7.1
Building a posterior predictive model
9.7.2
Posterior with rstanarm
9.8
Sequential regression modeling
9.9
Using default rstanarm priors
9.10
Summary
9.10.1
You are not done yet!
9.11
Resources:
9.12
Meeting Videos
9.12.1
Cohort 1
9.12.2
Cohort 2
9.12.3
Cohort 3
9.12.4
Cohort 4
10
Evaluating Regression Models
10.1
More Questions to Consider
10.2
Beware of Biases
10.3
Verifying Normal Regression Assumptions
10.4
Our Case Study
10.5
Posterior Predictive check
10.6
Dealing with Wrong Models
10.7
How Accurate are the Posterior Predictive Models?
10.7.1
Posterior predictive summaries
10.7.2
Cross-validation
10.7.3
Expected log-predictive density
10.8
Improving Posterior Predictive Accuracy
10.9
How good is the MCMC simulation vs how good is the model?
10.10
Meeting Videos
10.10.1
Cohort 1
10.10.2
Cohort 2
10.10.3
Cohort 3
10.10.4
Cohort 4
11
Extending the Normal Regression Model
11.1
Extending the Normal Regression Model
11.2
Utilizing a categorical predictor
11.3
Utilizing two predictors
11.3.1
Simulate 100 datasets from the prior models
11.3.2
Predict 3 p.m. temperature on specific days
11.4
Dreaming bigger: Utilizing more than 2 predictors!
11.5
Model evaluation & comparison
11.5.1
Evaluating predictive accuracy using visualizations
11.6
Evaluating predictive accuracy using cross-validation
11.7
Evaluating predictive accuracy using ELPD
11.7.1
The bias-variance trade-off
11.8
Meeting Videos
11.8.1
Cohort 1
11.8.2
Cohort 2
11.8.3
Cohort 4
12
Poisson & Negative Binomial Regression
12.1
Data Set 1
12.2
Normal Distribution
12.2.1
Exploratory Data Visualization
12.2.2
Outlier
12.2.3
Predictor Variables
12.3
Normal Regression
12.3.1
Posterior Predictive Check
12.4
Poisson Regression
12.4.1
Log-Link Function
12.4.2
rstan
12.4.3
Poisson Regression Assumptions
12.5
Prior Distribution
12.5.1
So Far
12.6
Posterior Distribution
12.6.1
Checks
12.6.2
Posterior Predictive Check
12.7
Interpretation
12.8
Posterior Prediction
12.9
Data Set 2
12.9.1
Poisson Regression
12.9.2
Posterior Predictive Check
12.9.3
Overdispersion
12.10
Negative Binomial Distribution
12.11
Negative Binomial Regression
12.11.1
Prior Distribution
12.11.2
Posterior Predictive Check
12.11.3
Interpretation
12.12
Generalized Linear Models
12.13
Meeting Videos
12.13.1
Cohort 1
12.13.2
Cohort 2
12.13.3
Cohort 4
13
Logistic Regression
13.1
The logistic regression model
13.1.1
Definition of Odds & probability
13.1.2
Specifying the priors:
13.2
Simulating the posterior
13.3
Prediction & classification
13.4
Model evaluation
13.4.1
Confusion matrix
13.5
Extending the model
13.6
Meeting Videos
13.6.1
Cohort 1
13.6.2
Cohort 2
13.6.3
Cohort 4
14
Naive Bayes Classification
14.1
Data: Palmer Penguins
14.2
Naive Bayes Classification
14.3
One Categorical Predictor
14.3.1
Recall: Bayes Rule
14.3.2
Calculation
14.4
One Numerical Predictor
14.4.1
Prior Probability Distributions
14.5
Two Predictor Variables
14.6
Implementation
14.6.1
Models
14.6.2
Predictions
14.7
Validation
14.7.1
Confusion Matrices
14.7.2
Cross-Validation
14.8
Summary
14.9
Meeting Videos
14.9.1
Cohort 1
14.9.2
Cohort 2
14.9.3
Cohort 4
I IV Hierarchical Bayesian models
15
Hierarchical Models are Exciting
15.1
Hierarchical Models are Exciting
15.2
Data: Cherry Blossom 5K
15.3
Pooled / Grouped data
15.4
Complete Pooling
15.4.1
Drawbacks of complete pooling
15.5
No pooling
15.6
Hierarchical data
15.7
Partial pooling
15.8
Summary
15.9
Meeting Videos
15.9.1
Cohort 1
15.9.2
Cohort 2
15.9.3
Cohort 4
16
(Normal) Hierarchical Models without Predictors
16.1
Data Set!
16.2
Complete pooled model
16.2.1
Quiz!!
16.3
No pooled model
16.3.1
Same Quiz but with no pooling!!
16.4
Building the hierarchical model
16.4.1
The hierarchy
16.4.2
within- vs -between-group variability
16.4.3
Posterior simulation
16.4.4
Posterior analysis of global parameters
16.4.5
posterior analysis of group specific
16.5
Posterior prediction
16.5.1
First case: Frank Ocean (j=39)
16.5.2
Posterior prediction for an observed group
16.5.3
posterior_predict()
16.6
Shrinkage & bias_variance trade-off
16.6.1
Quizzz!
16.7
Not everything is hierarchical
16.8
Summary
16.9
Meeting Videos
16.9.1
Cohort 1
16.9.2
Cohort 2
16.9.3
Cohort 4
17
(Normal) Hierarchical Models with Predictors
17.0.1
Data set
17.1
Quick: complete pooling option
17.2
Hierarchical Model with
varying intercept
17.2.1
Model buildings
17.3
Posterior simulation and analysis
17.4
Hierarchical model with varying intercepts & slopes
17.4.1
Model building
17.4.2
Posterior simulation and anlysis
17.5
Model evaluation and selection
17.6
Posterior prediction
17.7
Details: Longitudinal data
17.8
Example Danceability
17.9
Chapter summary
17.10
Meeting Videos
17.10.1
Cohort 1
17.10.2
Cohort 2
17.10.3
Cohort 4
18
Non-Normal Hierarchical Regression & Classification
18.1
Introduction
18.2
Hierarchical logistic regression
18.2.1
Model building & simulation
18.2.2
Posterior analysis
18.2.3
Posterior classification
18.2.4
Model evaluation
18.3
Hierarchical Poisson & Negative Binomial regression
18.3.1
Model building & simulation
18.3.2
Posterior analysis
18.3.3
Model evaluation
18.4
Meeting Videos
18.4.1
Cohort 1
18.4.2
Cohort 2
18.4.3
Cohort 4
19
Adding More Layers
19.1
Group-level predictors - Airbnb Data Revisited
19.2
Airbnb : Individual-level predictors
19.3
Air-bnb Hierachical structure
19.4
Air-bnb Group Level predictors
19.5
Incorporating group predictors
19.6
Airbnb median model
19.7
Airbnb posterior group-level analysis
19.8
Two or more grouping variables
19.9
Hiearchical model
19.10
Simulating the model
19.11
Posterior summaries
19.12
Group specific parameters
19.13
Check prediction manually
19.14
Further reading
19.15
The End
19.16
Meeting Videos
19.16.1
Cohort 1
19.16.2
Cohort 2
19.16.3
Cohort 4
Published with bookdown
Bayes Rules! Book Club
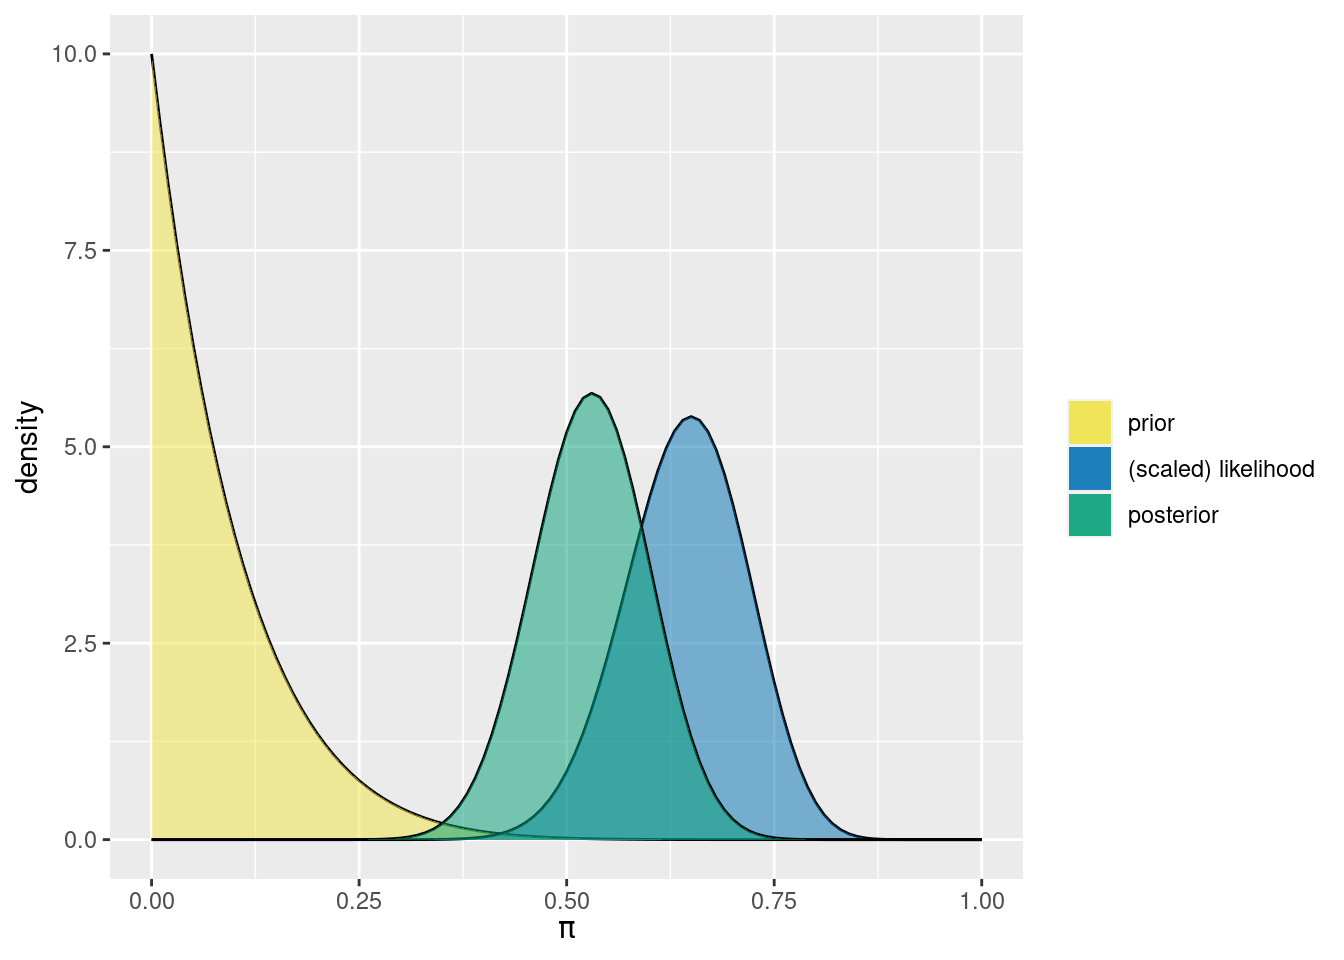
3.18
Let’s plot the prior, likelihood and posterior
plot_beta_binomial
(
alpha =
1
,
beta =
10
,
y =
26
,
n =
40
)