4.2 Why NOT Linear Regression?
- a regression method cannot convert a qualitative response variable with more than two levels into a quantitative response that is ready for linear regression
\[Y = \left\{ \begin{array}{ll} 1 & \mbox{if stroke};\\ 2 & \mbox{if epileptic seizure};\\ 3 & \mbox{if drug overdose}.\end{array} \right.\]
Depending on the complexity of the problem, a regression method will not provide meaningful estimates of Pr(Y |X);
There are times that a binary qualitative responses can be modeled using dummy variables approach. Example:
\[Y = \left\{ \begin{array}{ll} 0 & \mbox{if stroke};\\ 1 & \mbox{if drug overdose}.\end{array} \right.\]
- in such cases, the prediction of \(\hat{Y} > 0.5\), can be associated with .
- The main issue is partial estimates might be outside the [0, 1] probability interval, e.g. fig4-2:
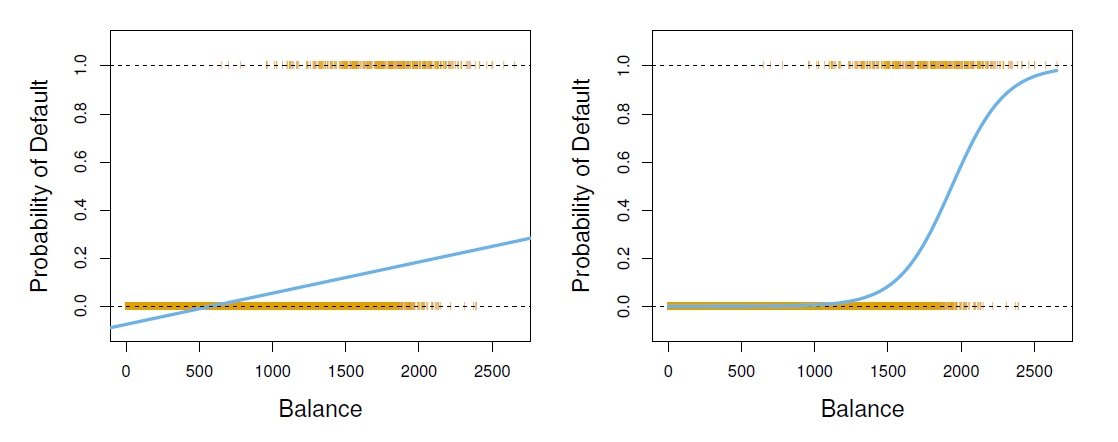
Figure 4.2: Classification using the Default data. Left: Estimated probability of default using linear regression. Some estimated probabilities are negative! The orange ticks indicate the 0/1 values coded for default(No or Yes). Right: Predicted probabilities of default using logistic regression. All probabilities lie between 0 and 1.