4.8 Linear regression with count data - negative values
The results of fitting a least squares regression model to the Bikeshare data provides some reasonable results:
as weather progressively worsens, the number of bikers decreases (coefficients become negative wrt baseline)
the coefficients associated with season and time of day match expected patterns (lowest in winter, and highest during peak commute times)
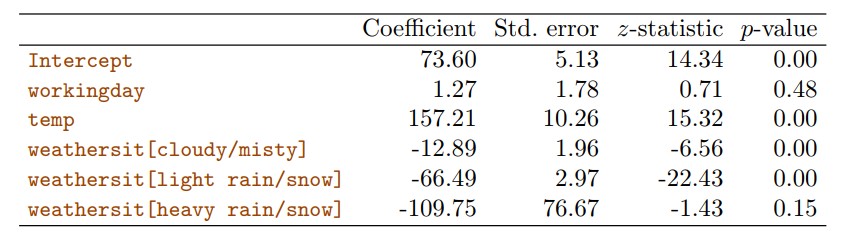
Figure 4.12: Results for a least squares linear model fit to predict bikers in the Bikeshare data. For the qualitative variable weathersit, the baseline level corresponds to clear skies.
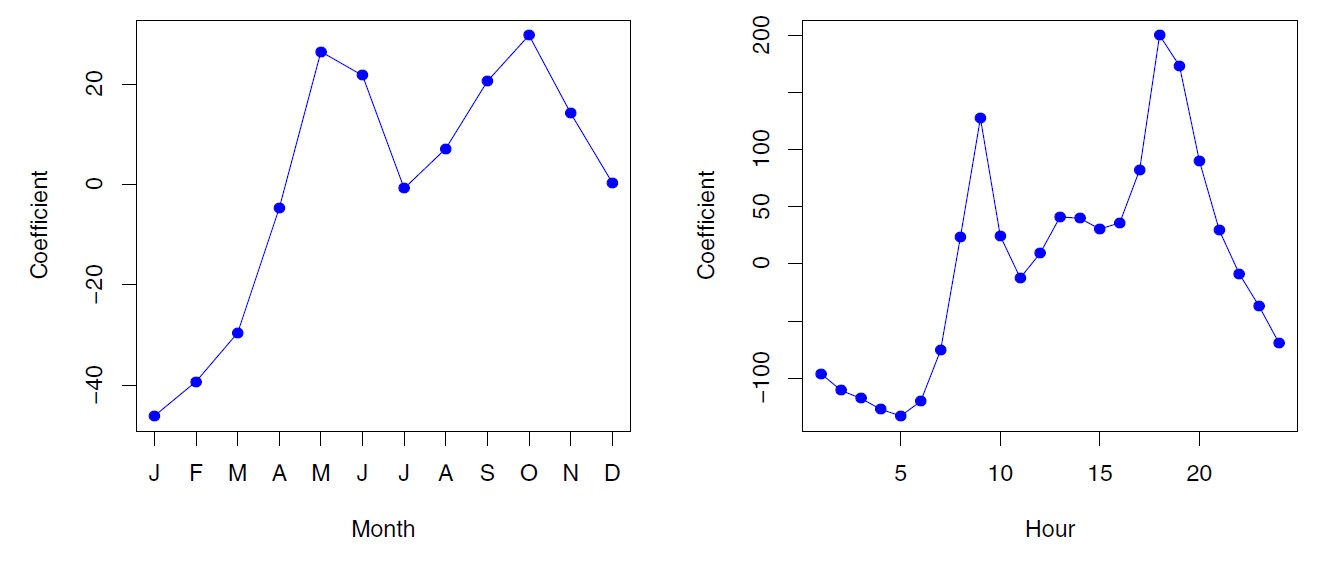
Figure 4.13: A least squares linear regression model was fit to predict bikers in the Bikeshare data set. Left: The coefficients associated with the month of the year. Bike usage is highest in the spring and fall, and lowest in the winter. Right: The coefficients associated with the hour of the day. Bike usage is highest during peak commute times, and lowest overnight.
Problem 1: model predicts negative numbers of bikers at times