8.13 Example: classification tree (Heart data)
Data contain a binary outcome HD (heart disease Y or N based on angiographic test) for 303 patients who presented with chest pain
13 predictors including Age, Sex, Chol (a cholesterol measurement), and other heart and lung function measurements
Cross-validation yields a tree with six terminal nodes
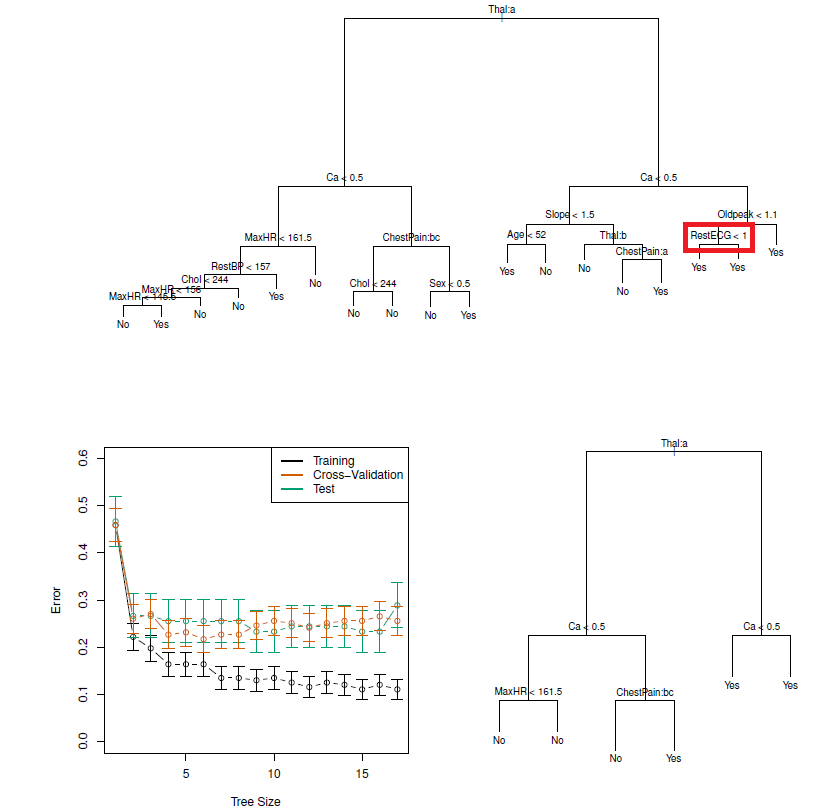
Figure 8.2: Heart data. Top: The unpruned tree. Bottom Left: Cross-validation error, training, and test error, for different sizes of the pruned tree. Bottom Right: The pruned tree corresponding to the minimal cross-validation error.
NOTE: classification trees can be constructed if categorical PREDICTORS are present e.g., the first split: Thal is categorical (the ‘a’ in Thal:a indicates the first level of the predictor, i.e. Normal levels)
Additionally, notice that some of the splits yield two terminal nodes that have the same predicted value (see red box)
Regardless of the value of RestECG, a response value of Yes is predicted for those observations
Why is the split performed at all?
- Because it leads to increased node purity: all 9 of the observations corresponding to the right-hand leaf have a response value of Yes, whereas 7/11 of those corresponding to the left-hand leaf have a response value of Yes
Why is node purity important?
- Suppose that we have a test observation that belongs to the region given by that right-hand leaf. Then we can be pretty certain that its response value is Yes. In contrast, if a test observation belongs to the region given by the left-hand leaf, then its response value is probably Yes, but we are much less certain
Even though the split RestECG<1 does not reduce the classification error, it improves the Gini index and the entropy, which are more sensitive to node purity