Let’s count High
High
carseats %>%
     count(High)
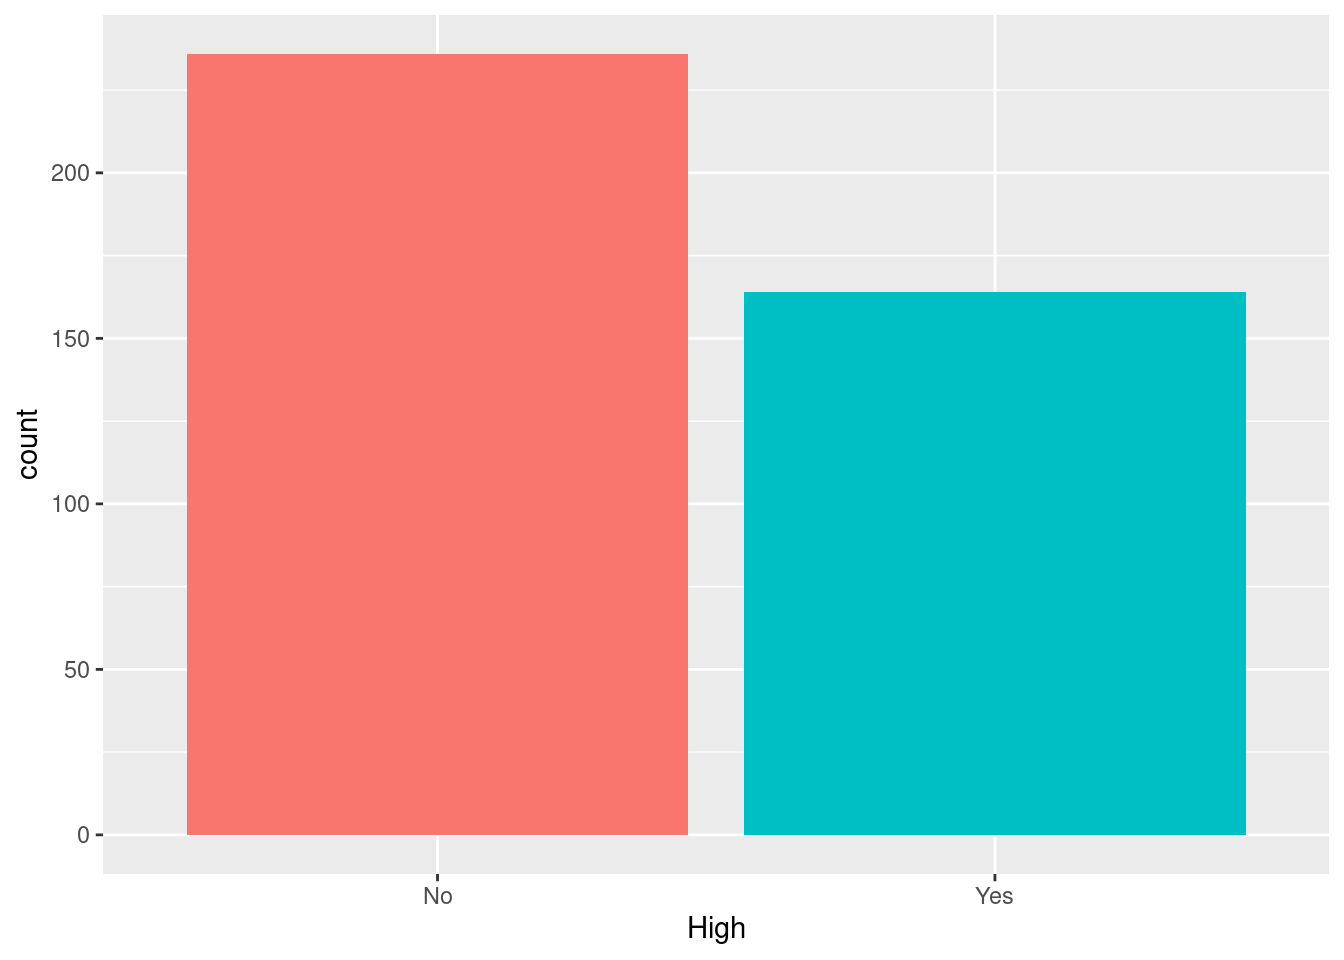
## # A tibble: 2 × 2
##   High      n
##   <fct> <int>
## 1 No      236
## 2 Yes     164
High plot
carseats %>%
     ggplot(aes(High, fill = High)) +
     geom_bar() +
     theme(legend.position = 'none')