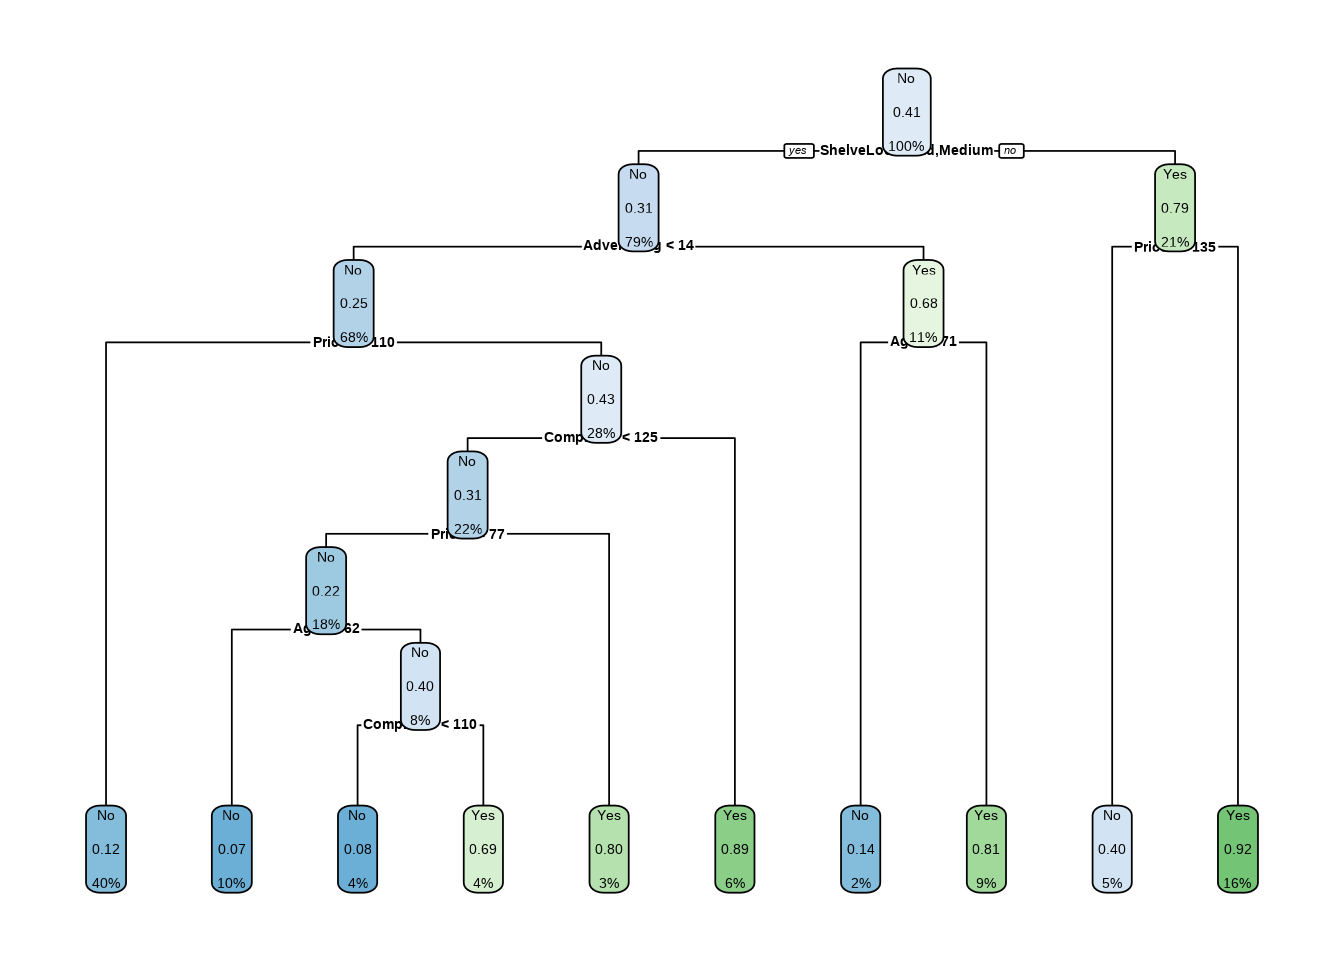
Visualize the tuned decision tree (classification)
At last, we can visualize the model, and we see that the better-performing model is less complex than the original model we fit.
class_tree_final_fit %>%
  extract_fit_engine() %>%
  rpart.plot(roundint = FALSE)