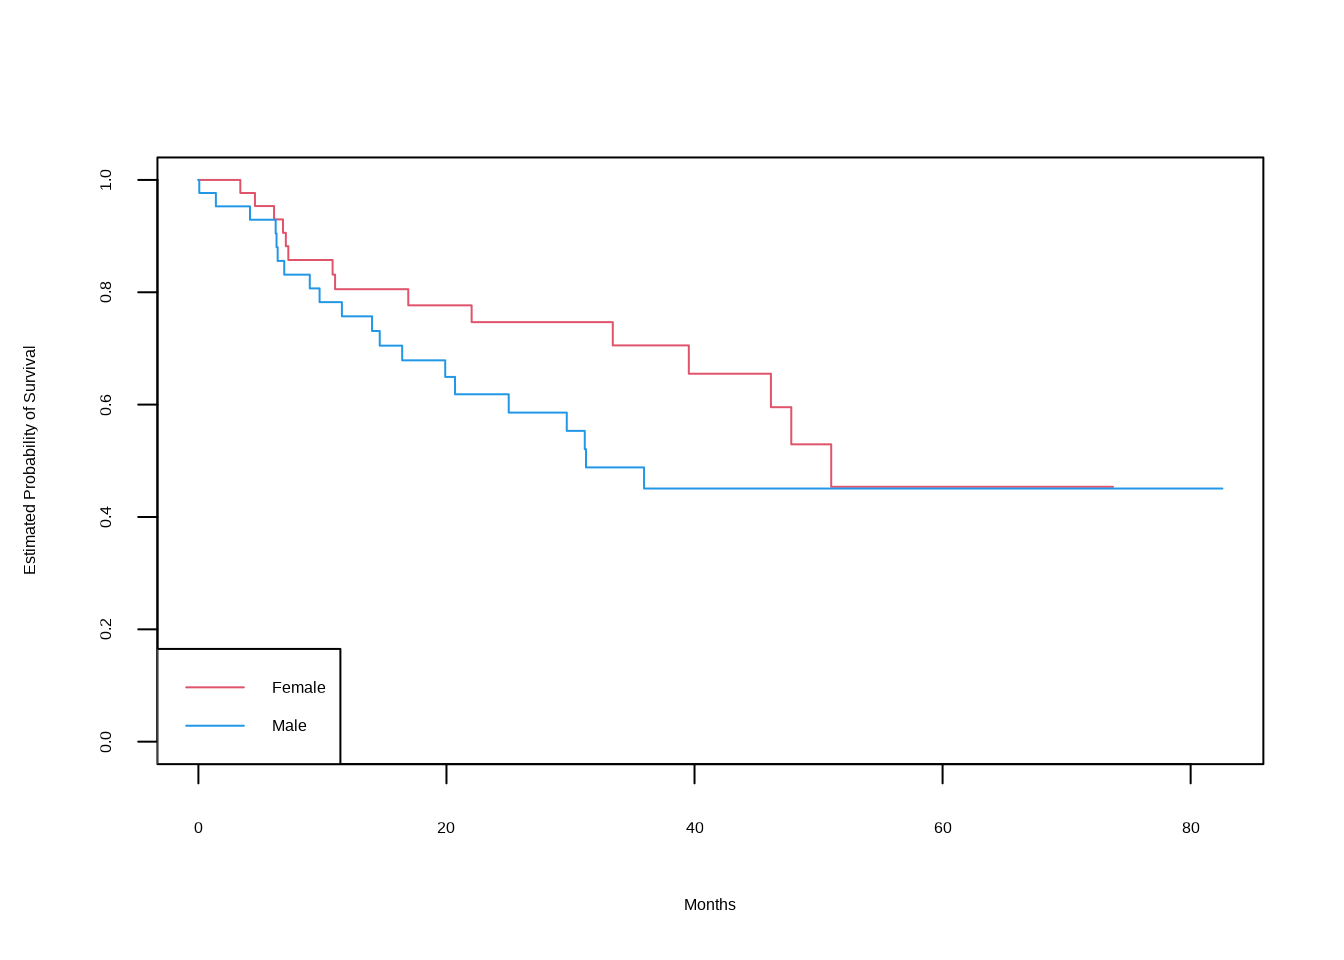
11.8 KM curve stratified by sex
Next we create Kaplan-Meier survival curves that are stratified by sex, in order to reproduce Figure 11.3.
fit.sex <- survfit(Surv(time, status) ~ sex, data = BrainCancer)
plot(fit.sex, xlab = "Months",
    ylab = "Estimated Probability of Survival", col = c(2,4))
legend("bottomleft", levels(BrainCancer$sex), col = c(2,4), lty = 1)