8.10 An example: tree pruning (Hitters data)
- Results of fitting and pruning a regression tree on the Hitters data using 9 of the features
- Randomly divided the data set in half (132 observations in training, 131 observations in the test set)
- Built large regression tree on training data and varied \(\alpha\) in Eq. 8.4 to create subtrees with different numbers of terminal nodes
- Finally, performed 6-fold cross-validation to estimate the cross-validated MSE of the trees as a function of \(\alpha\)
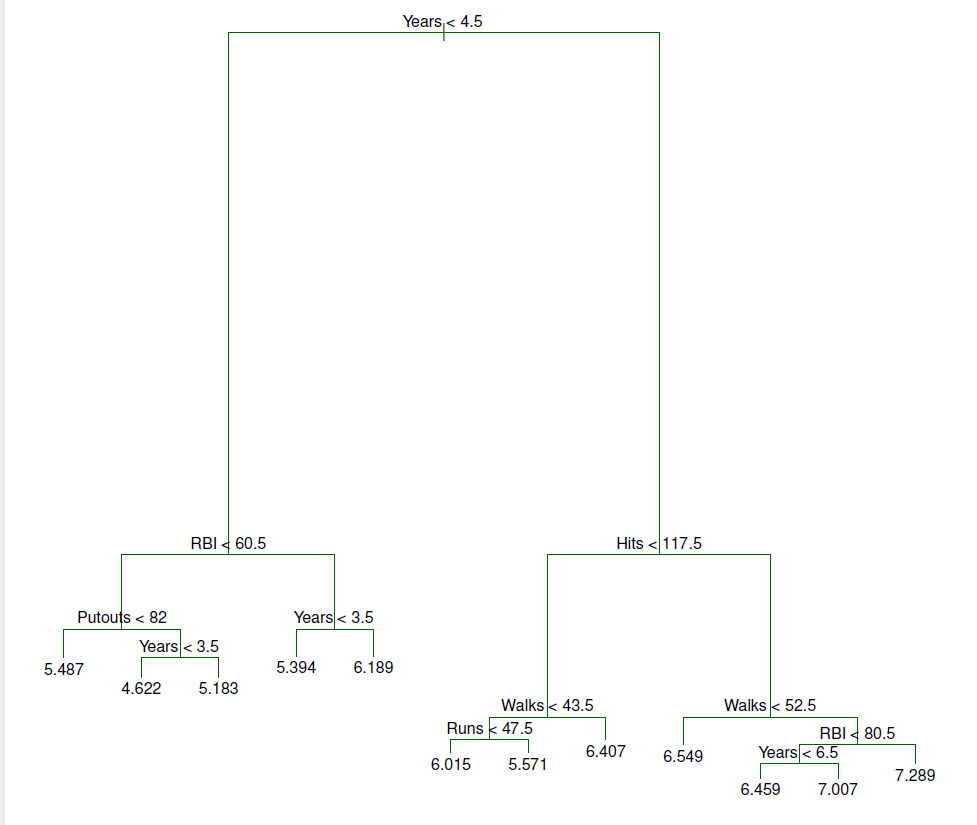
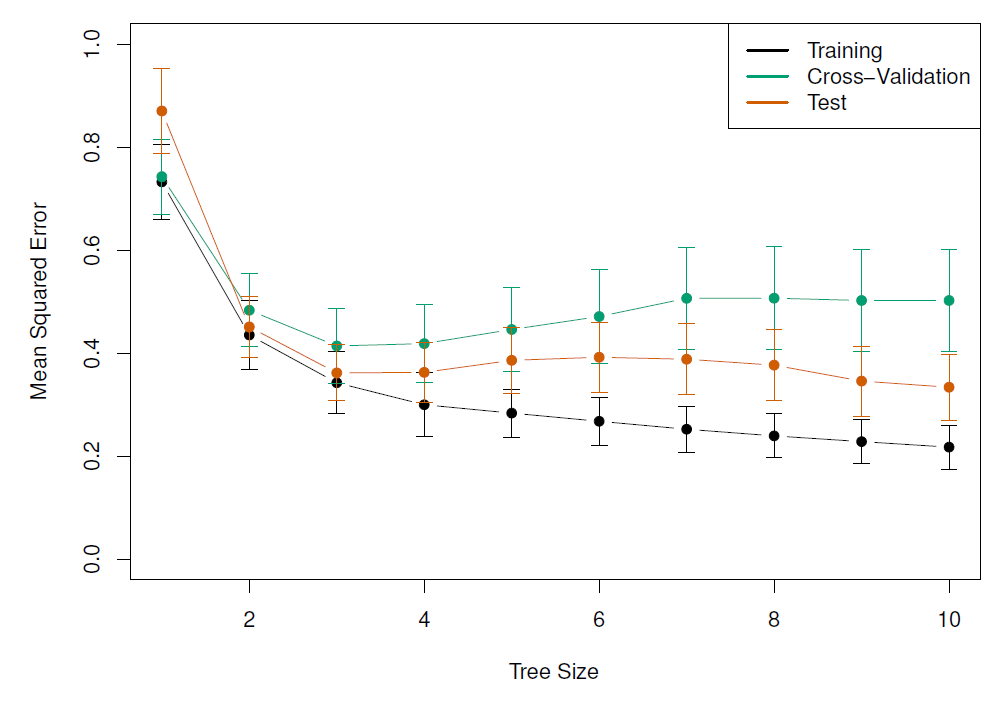
Figure 8.1: Training, cross-validation, and test MSE are shown as a function of the number of terminal nodes in the pruned tree. Standard error bands are displayed. The minimum cross-validation error occurs at a tree size of 3.